
Growing Guide
What Your Hardiness Zone Really Means
Sources: USDA Plant Hardiness Zone Map (PHZM), 2023 edition. 30-year minimum temperature averages 1991-2020.
Last updated:
Example: Zones 5b-7a (Mid-Atlantic)
 USDA Zones
3a - 13b
PHZM 2023
Based on
30-yr min temps
1991-2020 normals
Resolution
1/2-mile grid
PRISM interpolated
The one thing hardiness zones tell you
USDA hardiness zones answer exactly one question: will this plant survive winter here? The zone number is derived from the average annual extreme minimum temperature over 30 years of NOAA weather station data. Zone 6b, for example, means your location's coldest night in an average year falls between -5°F and 0°F.
When a plant label says "Hardy to Zone 5," it means the plant has demonstrated survival through winters where temperatures reach -20°F. If your parcel is in Zone 6 (-10°F to 0°F minimum), that plant should survive your winters with margin to spare.

Check YOUR hardiness zone
See your USDA zone plus the frost dates, GDD, and soil data that zones alone don't tell you.
Three things about your exact spot that zone averages miss:
We read public map data for this spot — soil, climate, flood, and parcel records. How we handle your address.
25+ data sources analyzed in seconds
The zone scale: 1 through 13
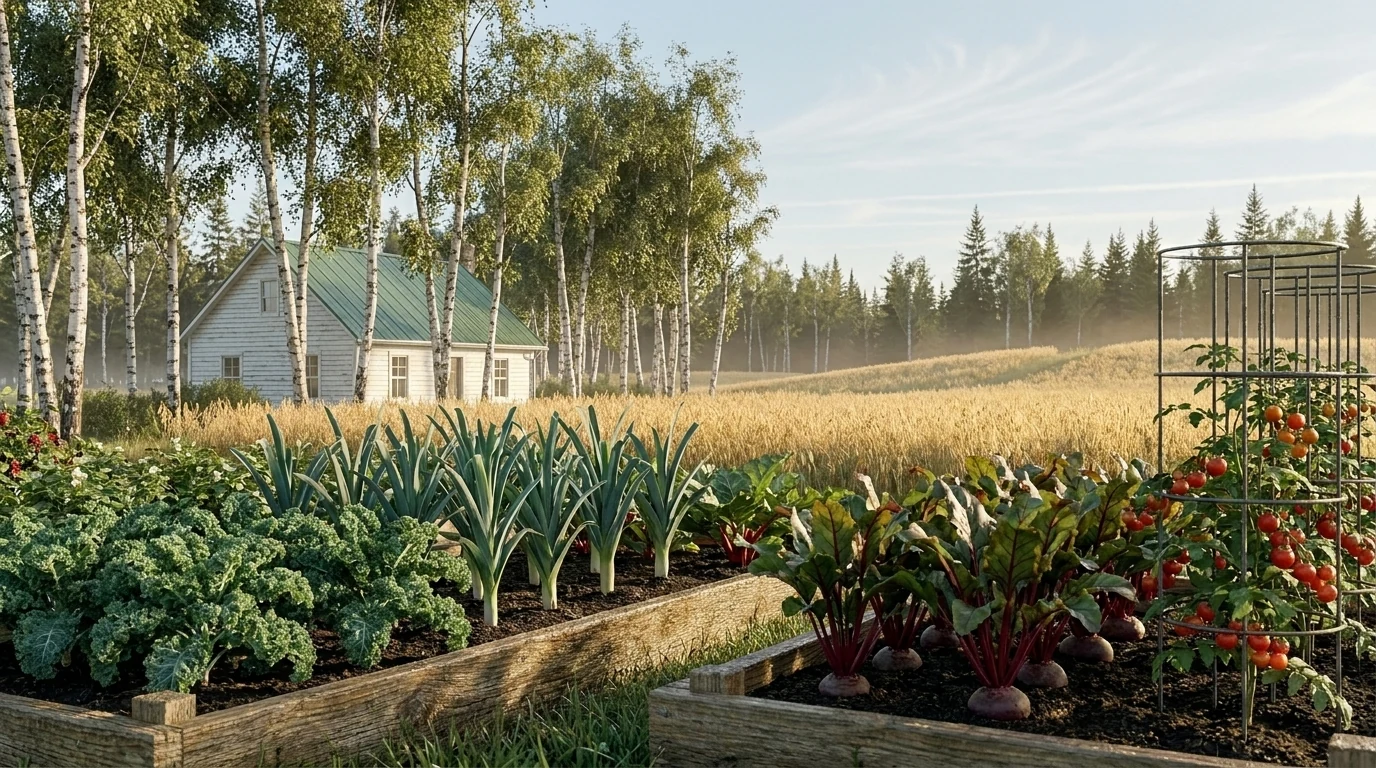
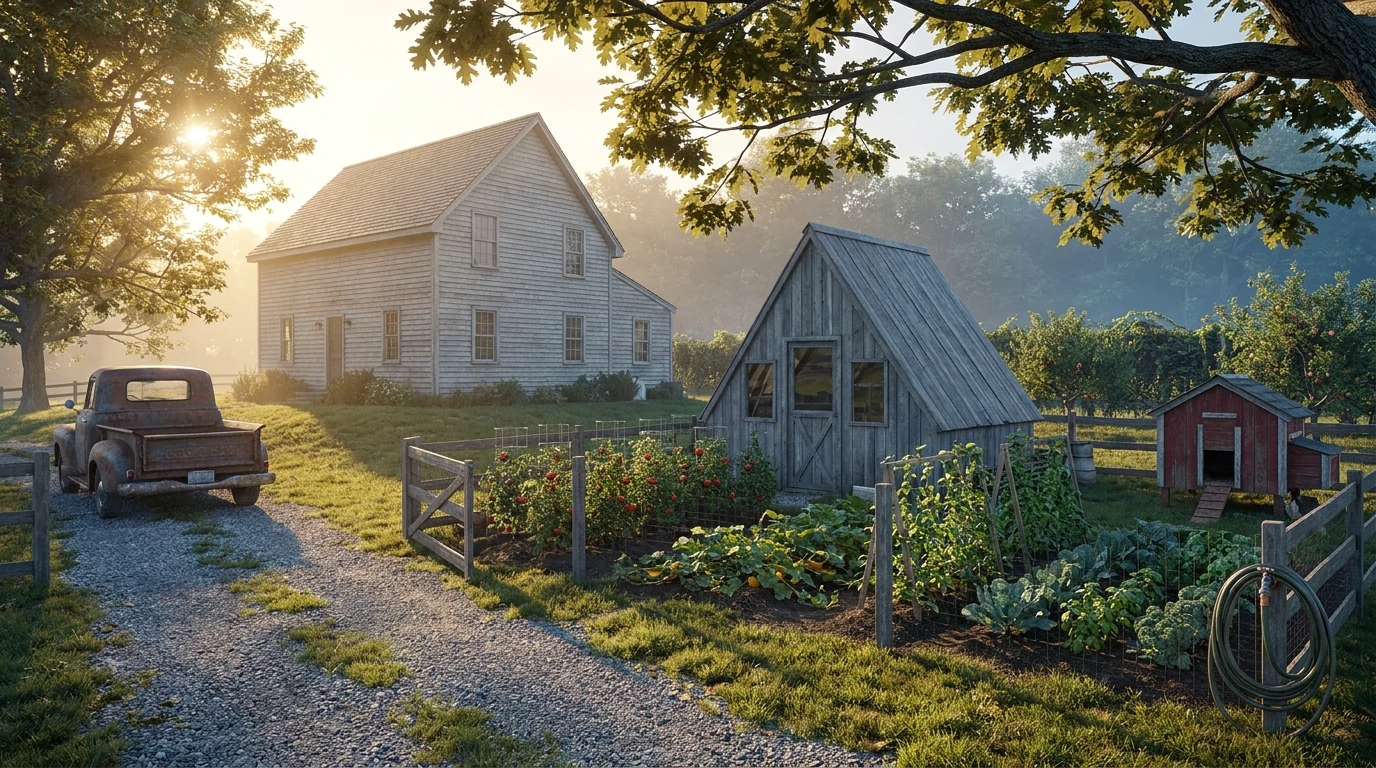
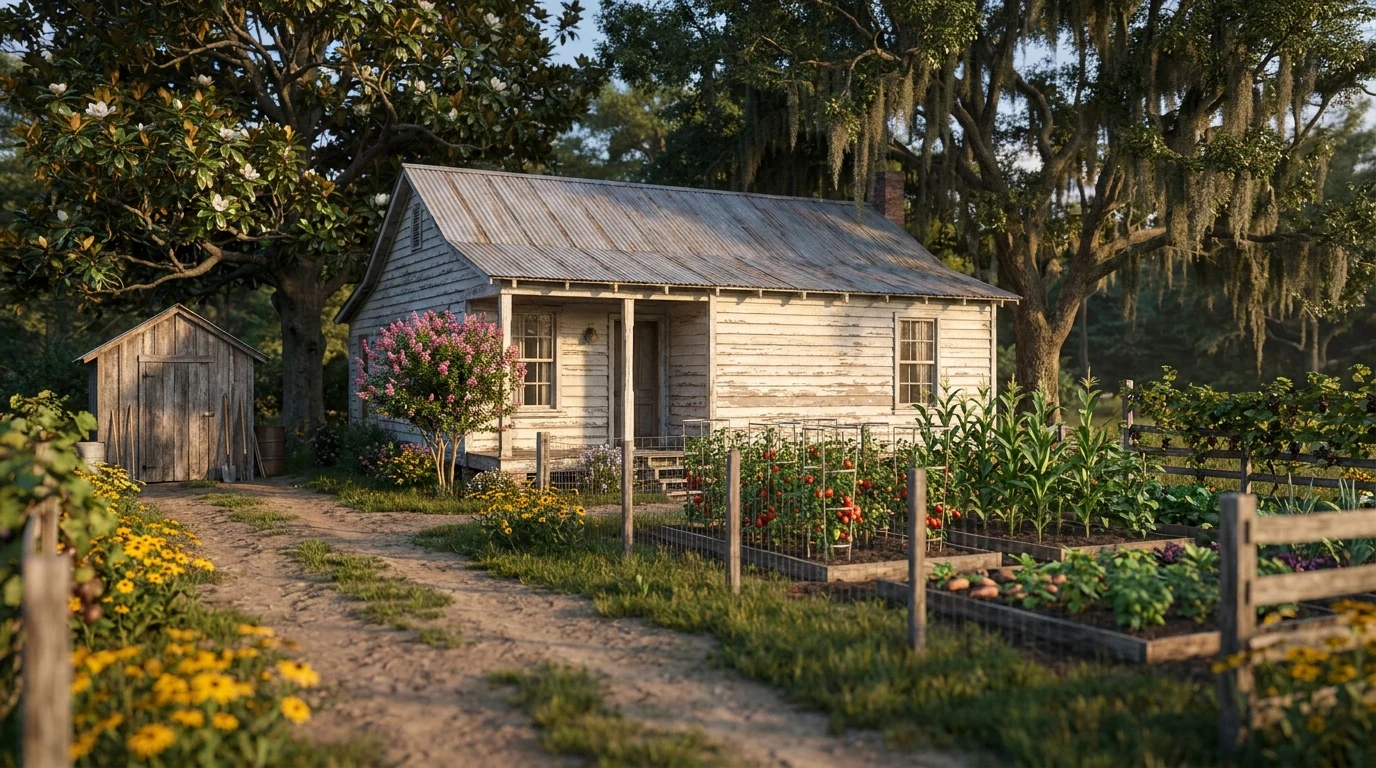
Each full zone spans 10°F. The "a" and "b" subdivisions split that into 5°F increments — Zone 6a (-10°F to -5°F) is meaningfully colder than Zone 6b (-5°F to 0°F). That 5-degree difference determines whether borderline plants like fig trees survive or die back to the ground each winter.
The national hardiness zone map
Each color band is a single USDA zone — its average annual extreme minimum temperature falls in a 5°F window. This map draws the continental US file of the 2023 PHZM (zones 3a-12a). USDA publishes separate Alaska, Hawaii, and Puerto Rico maps, which this map does not draw. Tap a zone to open its growing guide.
This map is derived from the USDA ARS / PRISM Plant Hardiness Zone Map (2023) and is not the official USDA Plant Hardiness Zone Map.
Source: USDA ARS Plant Hardiness Zone Map 2023 · PRISM Climate Group, Oregon State University · 1991-2020 normals
What hardiness zones don't tell you
Zones measure winter cold survival — nothing else. A plant can be "hardy" to your zone and still fail because of conditions zones don't capture:
- Summer heat: A Zone 5 plant may survive your winter but wilt in your summer. Growing degree days (GDD) and heat zone data capture this — hardiness zones do not.
- Rainfall and drought: Zone 7 in Oregon (45+ inches/year) grows entirely different plants than Zone 7 in West Texas (12 inches/year). Same zone, opposite moisture regimes.
- Soil type: A plant rated for Zone 6 in well-drained loam may rot in Zone 6 clay. Winter hardiness doesn't account for drainage, pH, or soil structure.
- Sun exposure: A shade-loving plant scored for Zone 6 may scorch on your south-facing, full-sun parcel — even though the zone is "right."
- Frost-free season length: Zone tells you about the coldest night, not the growing window. Two Zone 6b locations can have 120 or 180 frost-free days depending on geography.
This is why Growable Ground scores plants against 10+ constraints — not just hardiness zone. Zone is the first filter, not the answer.
Microclimates: Why your parcel is different from the map
The USDA hardiness zone map assigns zones based on weather station data interpolated across a 30 arc-second grid, about 800 m per cell. But within that grid, local conditions create microclimates that can shift your effective growing zone by one full number:
Warmer than the map says
- South-facing slopes (more direct sun, faster soil warming)
- Near large bodies of water (thermal mass moderates extremes)
- Urban heat islands (pavement and buildings radiate warmth)
- Against south-facing walls (reflected heat, wind protection)
Colder than the map says
- Valley bottoms and low spots (cold air pools downhill)
- North-facing slopes (less direct sun, slower warming)
- Exposed ridgetops (wind chill reduces effective temperature)
- Frost pockets where cold air is trapped by terrain or structures
Growable Ground reads USGS elevation, LiDAR-derived terrain, and NOAA RCC-ACIS frost dates specific to your parcel coordinates — capturing microclimate effects that zip-code tools miss.
Pro TipCheck YOUR hardiness zone
See your USDA zone plus the frost dates, GDD, and soil data that zones alone don't tell you.
Three things about your exact spot that zone averages miss:
We read public map data for this spot — soil, climate, flood, and parcel records. How we handle your address.
25+ data sources analyzed in seconds
Frequently Asked Questions
What is a USDA hardiness zone?
USDA hardiness zones divide the US into regions based on average annual extreme minimum temperature. Zone numbers range from 1 (coldest, below -60°F) to 13 (warmest, above 60°F). Each zone spans 10°F, with "a" and "b" subdivisions spanning 5°F each.
Why is hardiness zone not enough to know what I can grow?
Hardiness zones only measure winter cold survival. They do not account for summer heat, rainfall, soil type, sun exposure, growing season length, or frost dates — all of which determine whether a plant actually thrives versus merely surviving.
What is a microclimate and how does it affect my garden?
A microclimate is a localized climate difference caused by terrain, buildings, water bodies, or vegetation. South-facing slopes are warmer. Low spots collect cold air (frost pockets). Urban heat islands run warmer than the surrounding countryside — the EPA puts the difference at roughly 1–7°F by day and 2–5°F at night — sometimes enough to carry borderline plants through winter.
Browse Every USDA Zone
Each zone has its own page — what grows there, the temperature window, and which states the zone covers. Pick yours, or explore the climate ladder from arctic to tropical.
Related Guides
Sources & further reading
- USDA PHZM — the 2023 USDA Plant Hardiness Zone Map
- PRISM Climate — the climate normals behind the zones
- NOAA RCC-ACIS — gridded daily temperature record
See what this means where you are
This guide is national — a state's own zones, frost dates and soils change how it plays out. Start with your state's growing hub: