
Appalachia spans USDA hardiness zones 5b-8b — a band that supports both cool-season staples and warm-season crops chosen to fit the local frost window.
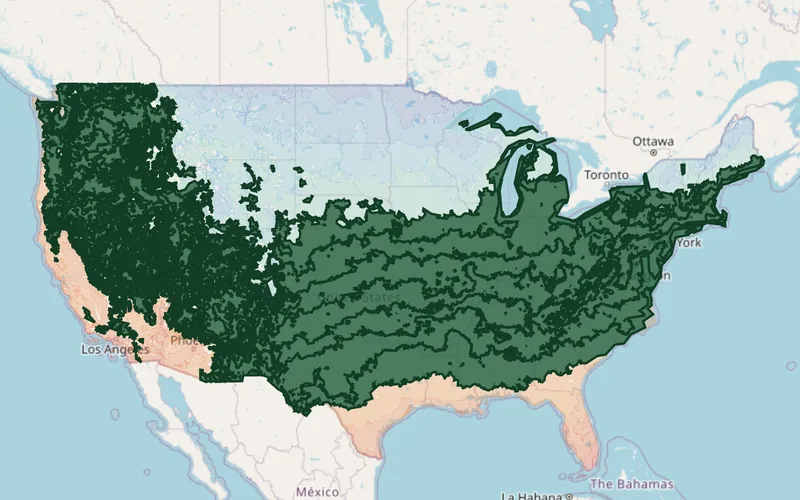
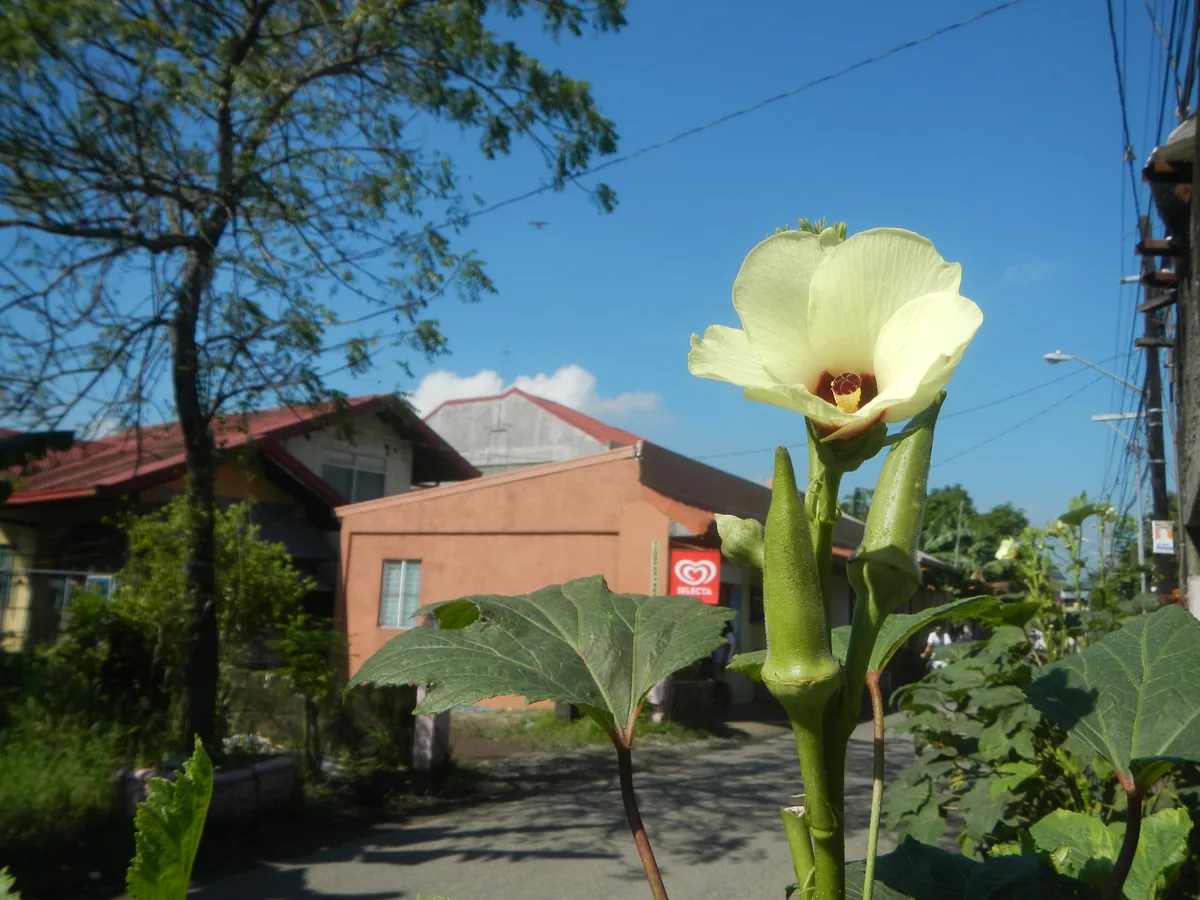
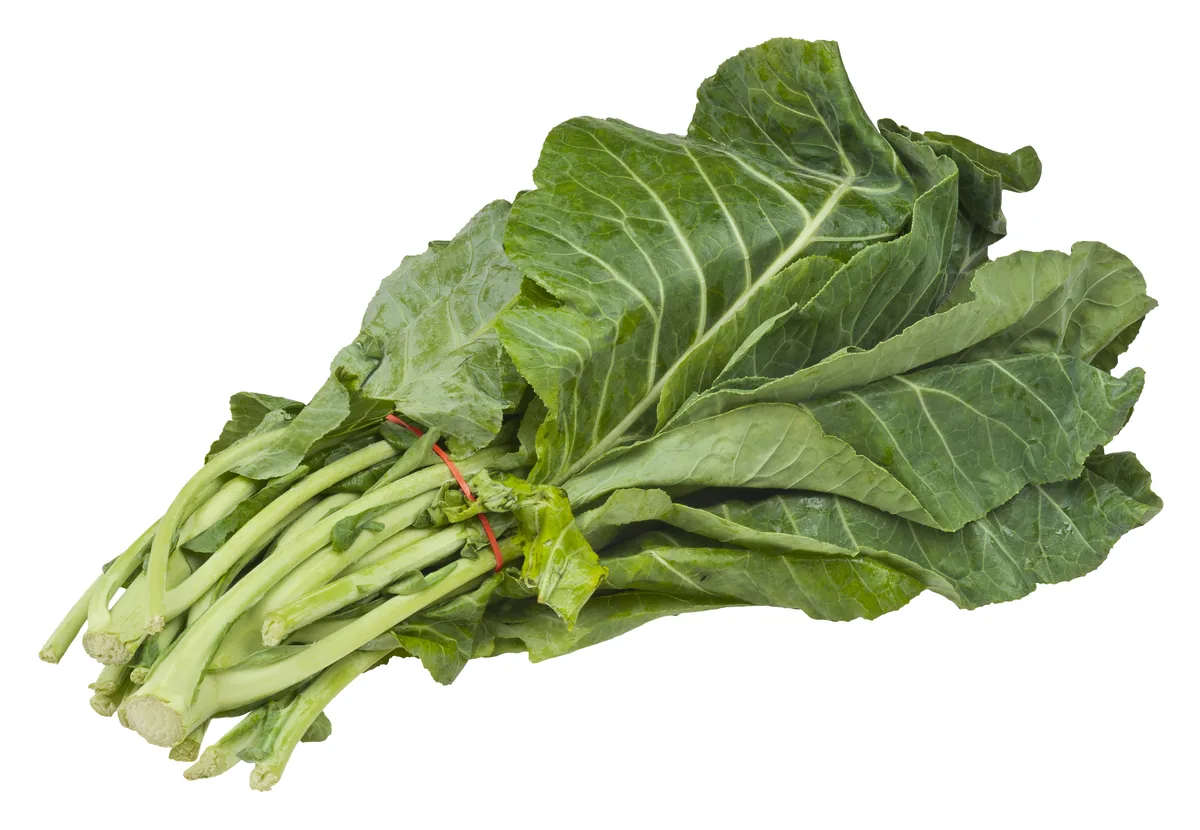
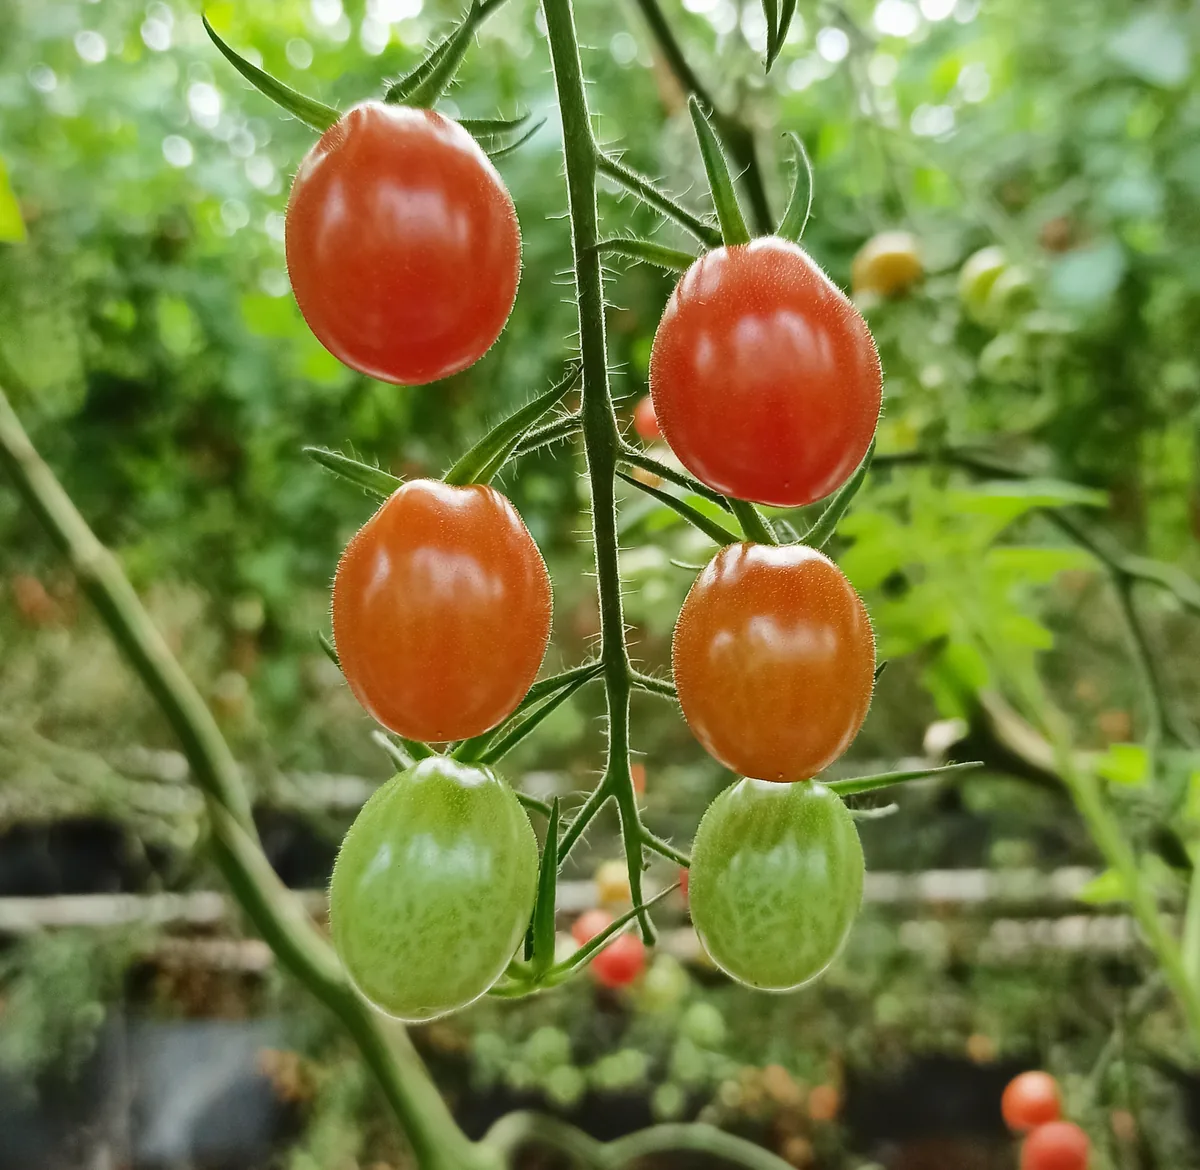
The vast eastern mountain region of steep hollows, thin acidic soils, and short upland seasons — apples, brambles, ramps, and forest crops on hard-won ground. (Union of the core Appalachian ecoregions.) Reliable performers under these conditions include okra, collard greens, tomato, and sweet corn; what your own ground favors still comes down to its soil, sun, and drainage.
Appalachia spans Alabama, Georgia, Kentucky, Maryland, New Jersey, New York, North Carolina, Ohio, Pennsylvania, Tennessee, Virginia and West Virginia. Its footprint follows the EPA Level III ecoregion boundary; the counties linked below are representative of the region, not an exhaustive list.
Your yard isn't all of Appalachia.
Appalachia spans USDA zones 5b-8b, but your parcel sits in exactly one — and slope, tree cover, and low spots nudge it further. Enter your address and we'll score 1,085 plants against your land's actual soil, sun, and frost.
We read public map data around Appalachia — soil, climate, flood, and parcel records. How we handle your address.
No card required · your parcel report in seconds — read in full free for your first 14 days
Appalachia — the short answer
Appalachia: USDA zones 5b-8b, 156–281 frost-free days depending where in it you stand, across 12 states.
- USDA zones
- 5b-8b
- USDA PHZM 2023, aggregated over the footprint
- Shortest season here
- 156 days
- NOAA Regional Climate Centers ACIS, 1991-2020 — Cattaraugus County
- Counties
- 306
- US Census TIGER/Line 2025
- Region type
- EPA ecoregion
- Growable Ground growing-region registry
Region boundary: Growable Ground growing-region registry — curated county clusters, EPA Level III ecoregions, and town clusters drawn finer than any county. The season figure is this region's own record, measured across its 306 member counties, not a state or national average.
Appalachia is not one growing season
One answer for Appalachia averages 306 counties whose growing seasons are 125 days apart — from 156 frost-free days in Cattaraugus County to 281 in Shelby County. That is the same region, measured the same way, in the same years. Which end of it your land sits nearer decides what finishes before the first hard freeze.
The middle half of 306 counties runs 200–221 days, with a median of 211 days — a 125-day span end to end.
Measured across 306 member counties, each carrying its own 28°F normal. NOAA Regional Climate Centers ACIS, 1991-2020. A member with no own record is absent from the range rather than counted as zero — nothing here is interpolated to the region. Your own site sits somewhere inside this range; a parcel report resolves where.
Where the line runs inside Appalachia
The middle half of Appalachia runs 200–221 frost-free days, and 148 of its 306 counties sit outside that — 73 on the short side, 75 on the long. A regional planting date describes the middle well and the ends poorly, which is worth knowing before you follow one.
Under 200 frost-free days
73 counties
- Cattaraugus County · 156 days
- Potter County · 160 days
- McKean County · 164 days
3 of 73 shown
The end of the region that sets the planting calendar — start seed indoors here and the season stretches to meet the crop.
200–221 frost-free days
158 counties
0 of 158 shown
The middle half of the region, and the part a single regional season describes well.
Over 221 frost-free days
75 counties
- Shelby County · 281 days
- Jefferson County · 270 days
- Marshall County · 268 days
3 of 75 shown
Long enough for a second succession of a quick crop after the first comes out.
Each county is placed by its OWN 28°F frost-free normal (NOAA Regional Climate Centers ACIS, 1991-2020), the same figure its own guide page publishes. Elevation, slope and cold-air drainage move a site within its county as well — which is the part only your address resolves.
What Grows in Appalachia
All 5 of the plants below that publish a season requirement clear even Cattaraugus County’s 156 frost-free days — so on season alone, this grid works at both ends of the region. The 125-day spread still decides how far past this list you can push, and how early you can start.
Plants matched to Appalachia's USDA zones 5b-8b, ordered by how much hardiness margin each has across the region — the ones with room to spare at both ends of this band lead. Each links to its full growing profile.
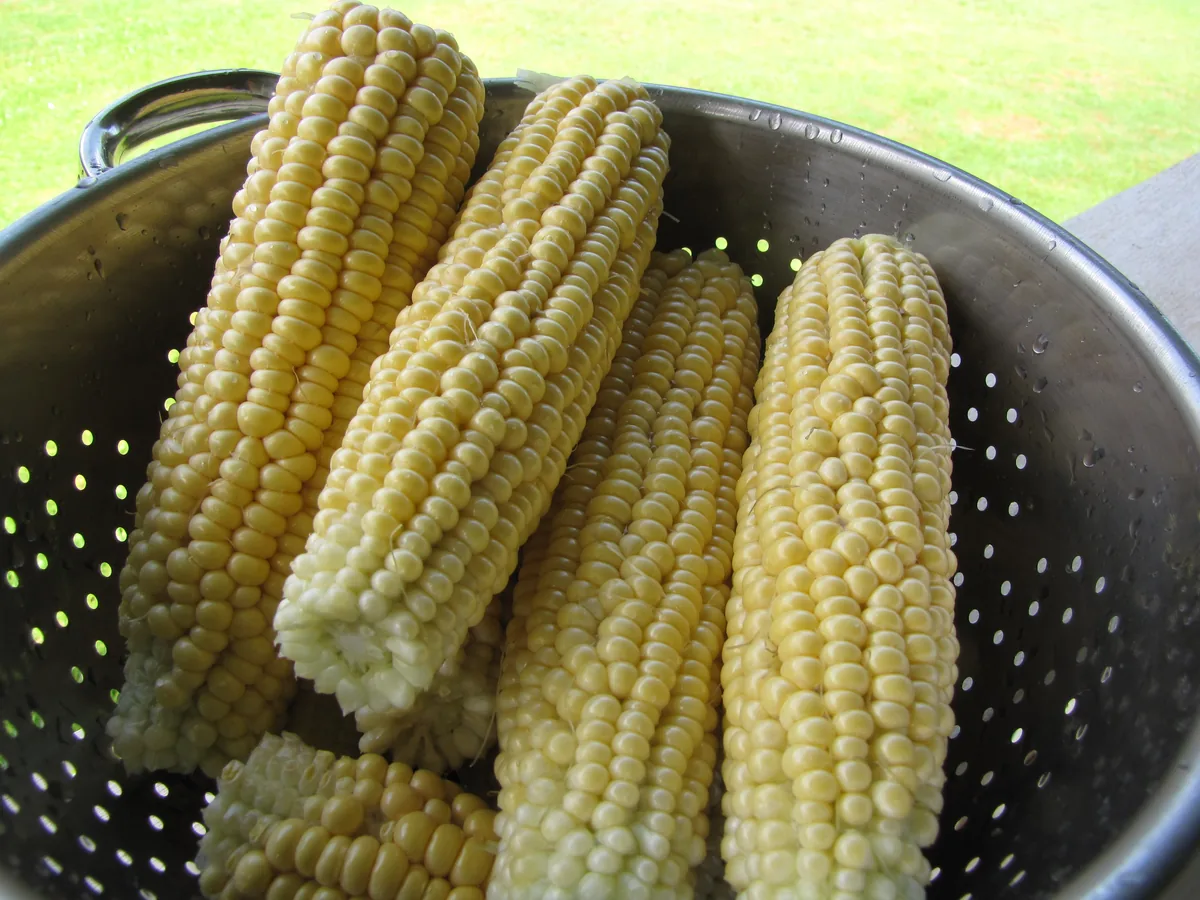
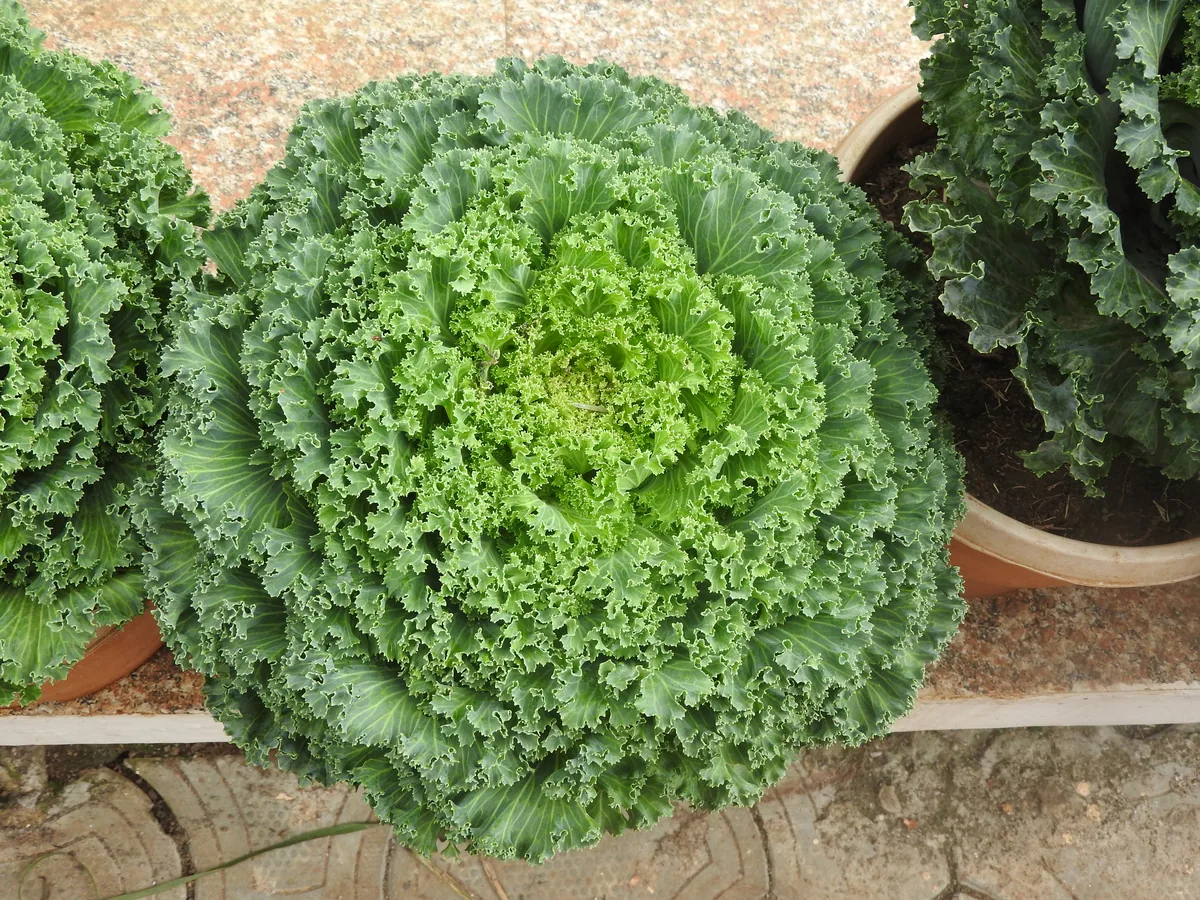
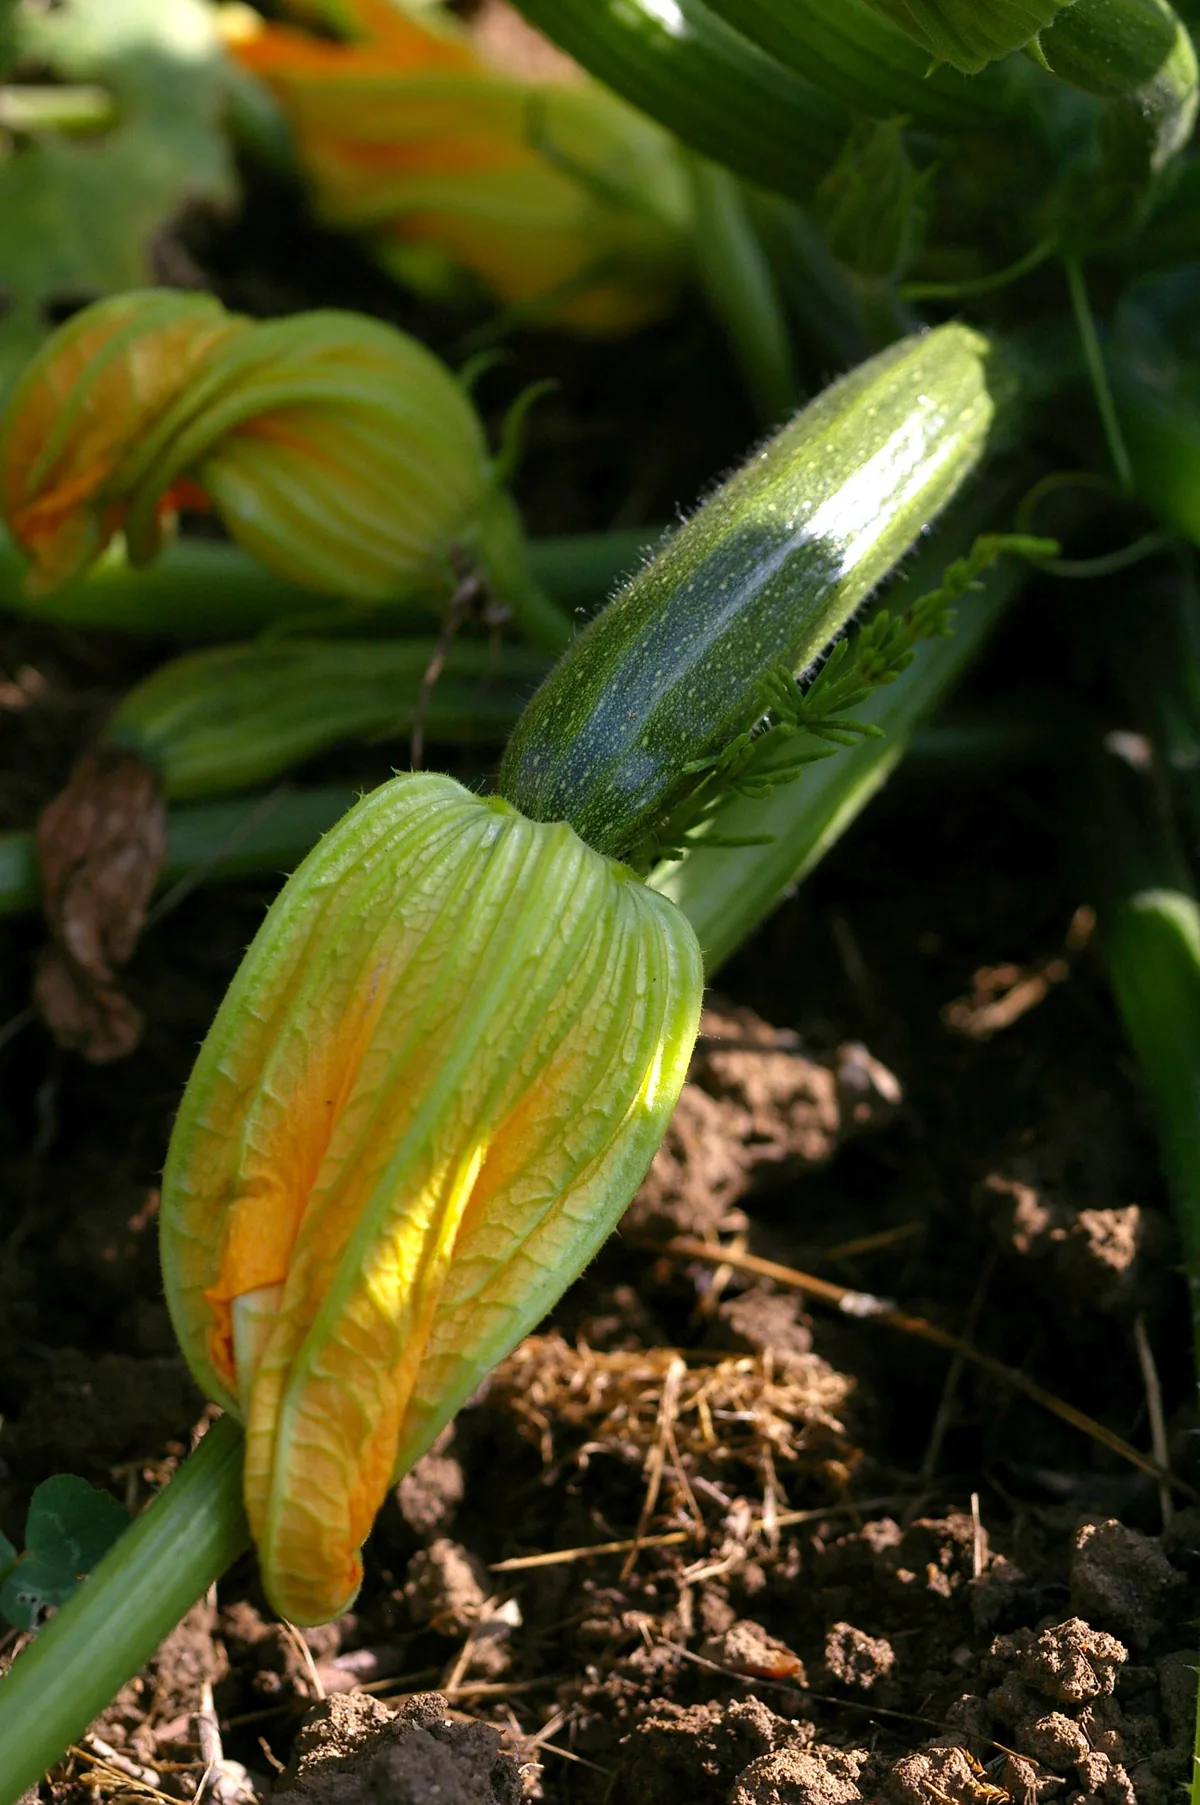
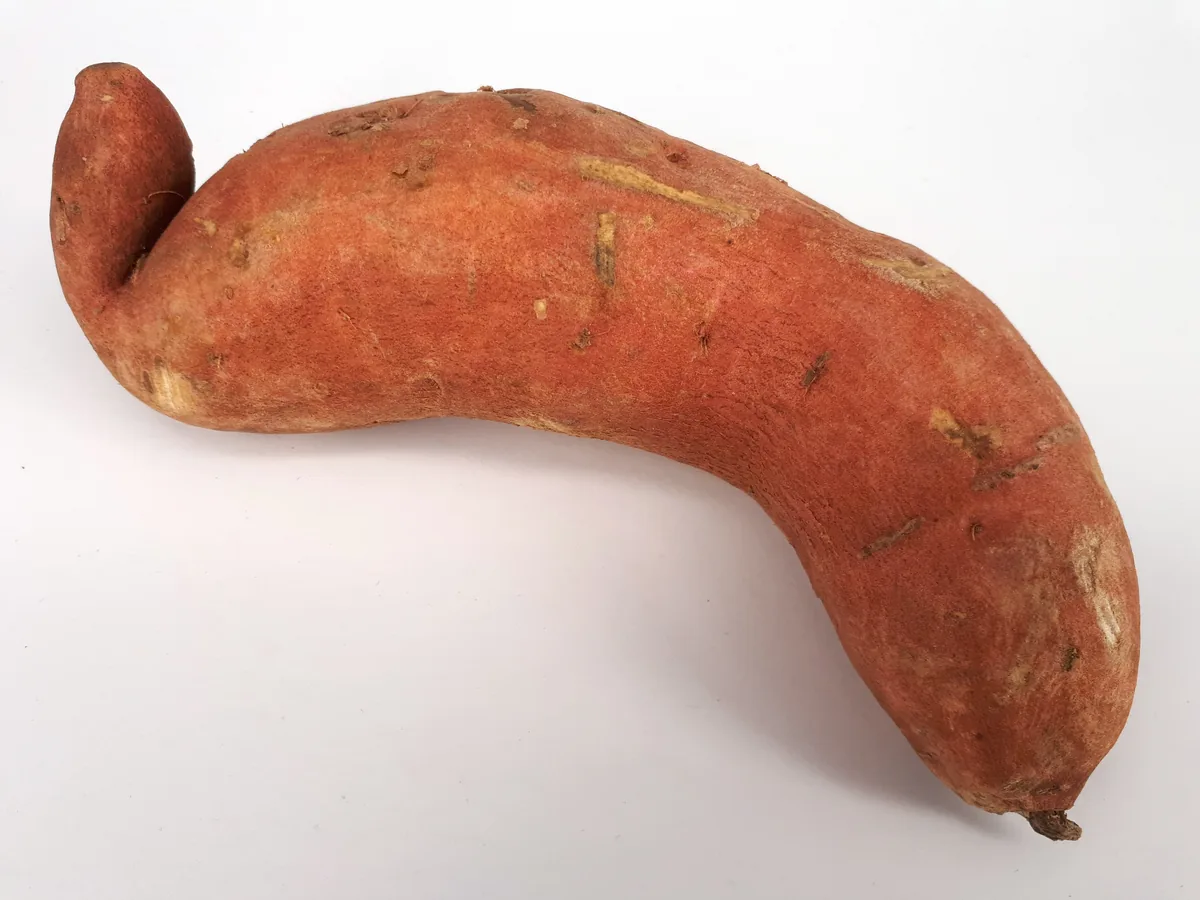
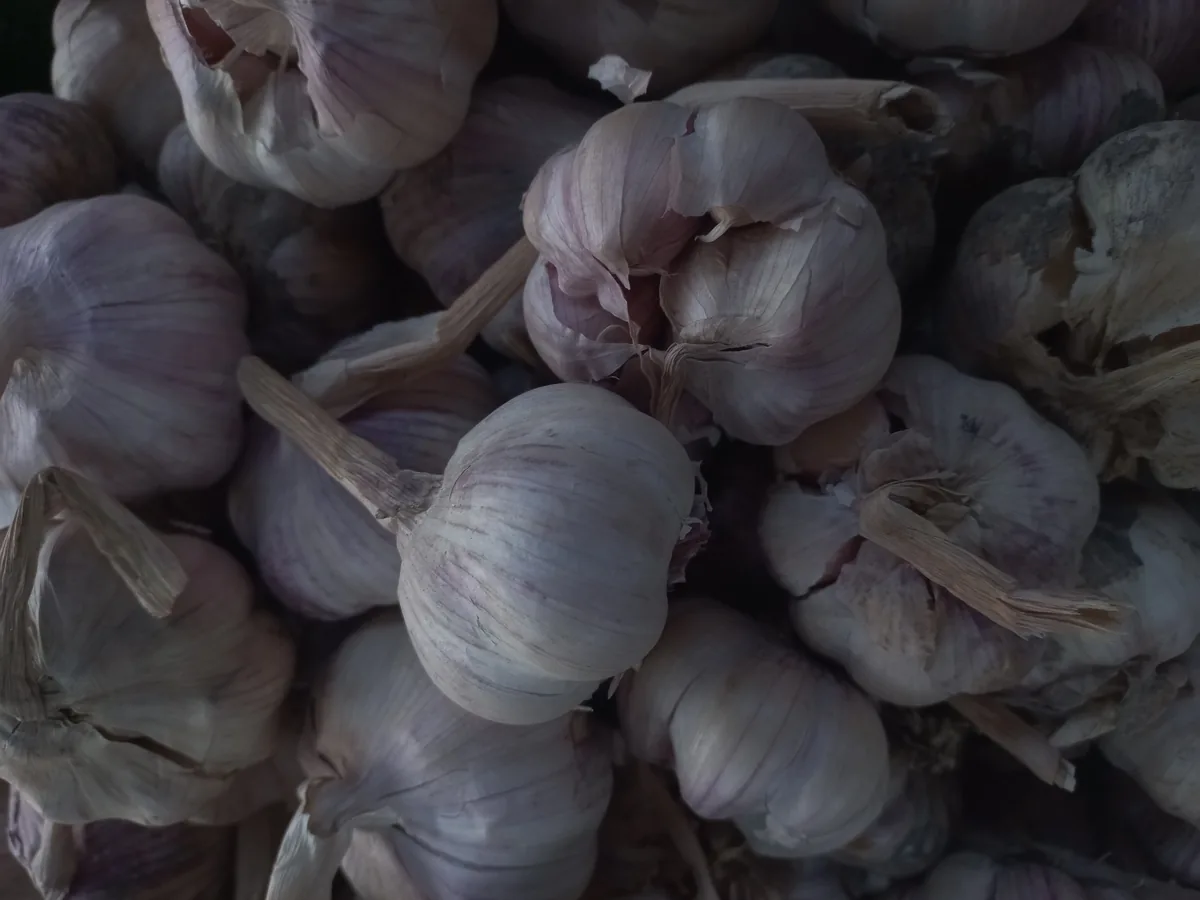
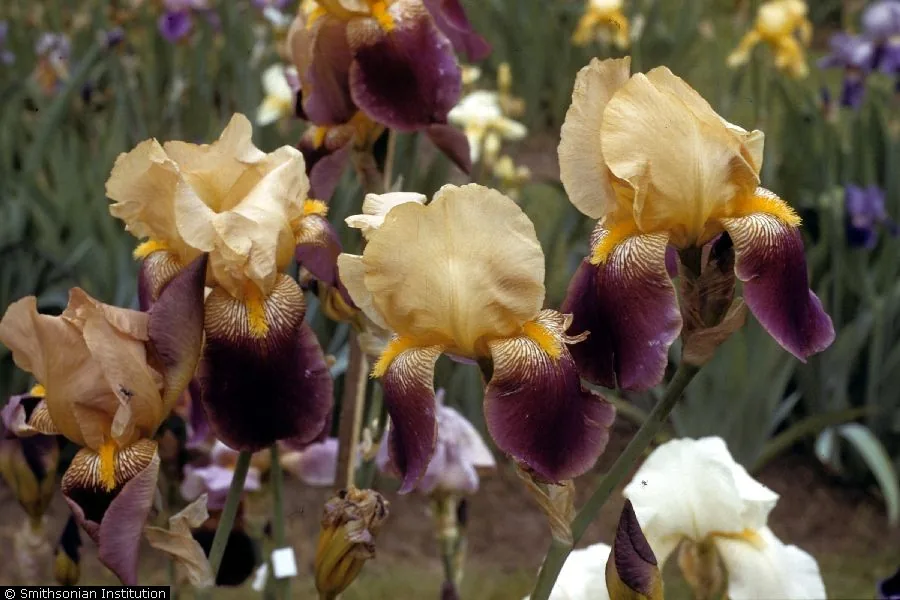
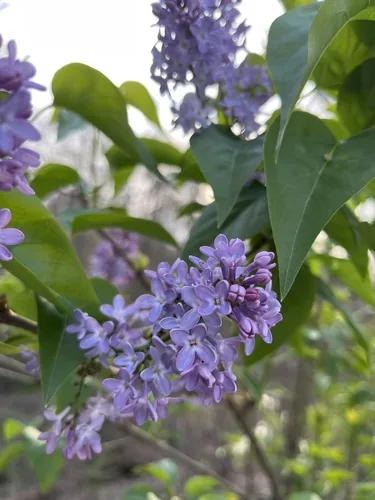
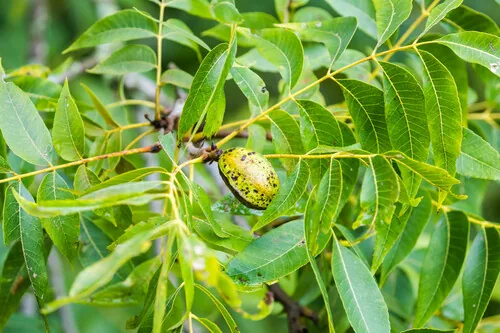
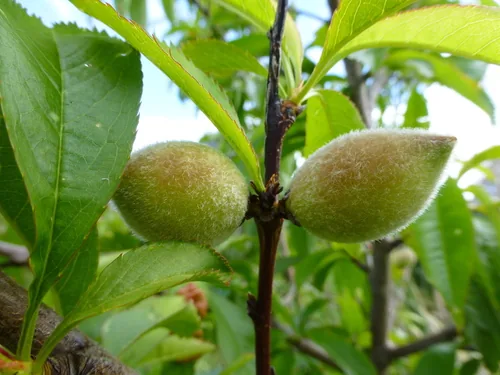
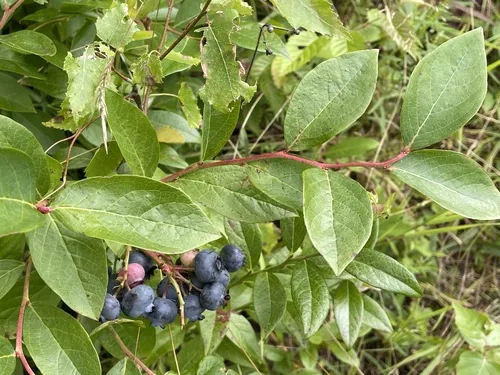
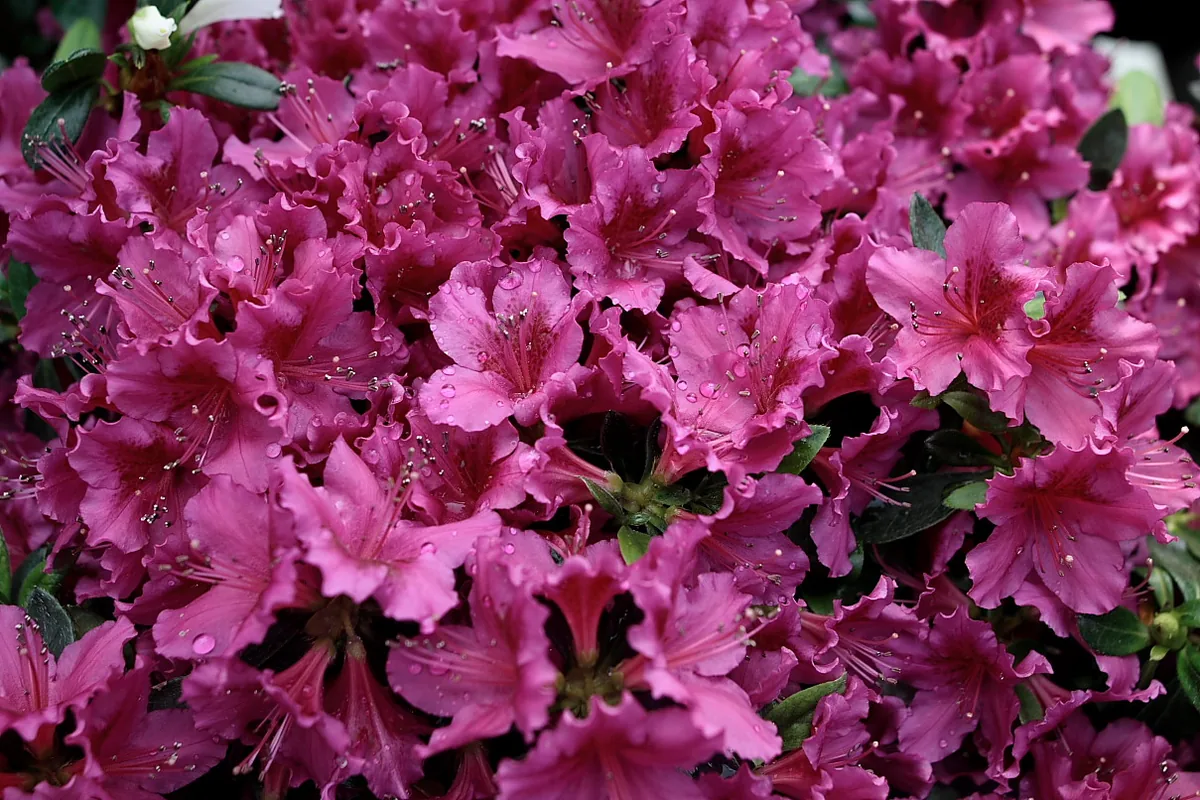
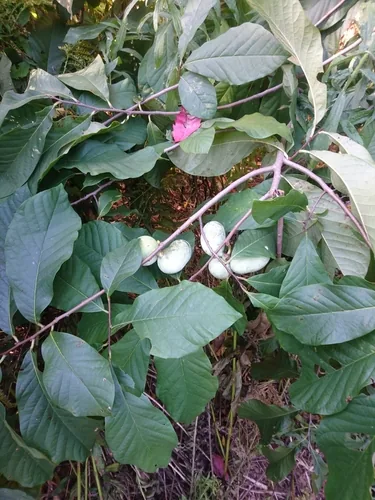
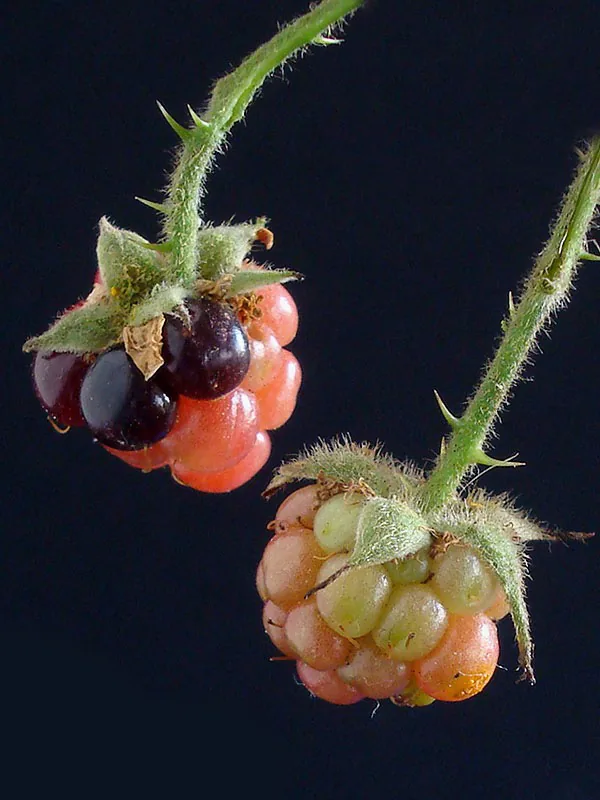
Native Plants of Appalachia
Plants the USDA PLANTS Database documents as native and present in all 12 states this region crosses, kept only where the published hardiness range meets Appalachia’s USDA zones 5b-8b — closest range match first. Presence is recorded by state, so a plant can be documented across the state and still be scarce in your corner of the region.
The ground across Appalachia
The USDA soil survey maps this ground county by county. These are those records weighted by land area across 299 member counties — this region’s own profile, not a state figure.
The ground is predominantly Ultisols, at 47% of mapped acres, followed by Inceptisols (33%), Alfisols (15%) and Entisols (4%). Eight soil orders appear somewhere inside the footprint, which is the honest reason a regional soil answer only goes so far. The most extensive named soils are Gilpin, Berks, and Shelocta.
74% of those acres are well drained, and another 13% moderately well drained, 5% somewhat excessively drained. Topsoil pH runs 4.0–7.0 between the lowest and the highest county on record. 10% of the footprint is classed prime farmland.
Soil order
Ultisols
Drainage
Well drained
Topsoil pH
4.0–7.0
Hydric soils
2%
Soil changes across a driveway, so which of these your own ground sits on is a parcel question rather than a regional one. Orange County holds the most wetland ground here, at 17% — soil types explained.
USDA NRCS SSURGO via Soil Data Access · 299 of 306 footprint counties carry a summarizable record; the rest are absent from these figures rather than estimated.

What this means for growing in Appalachia
The soil survey reads this ground county by county, and the readings above are those records summed across Appalachia. Here is what they mean for a garden here — and the move an experienced grower makes about each one.
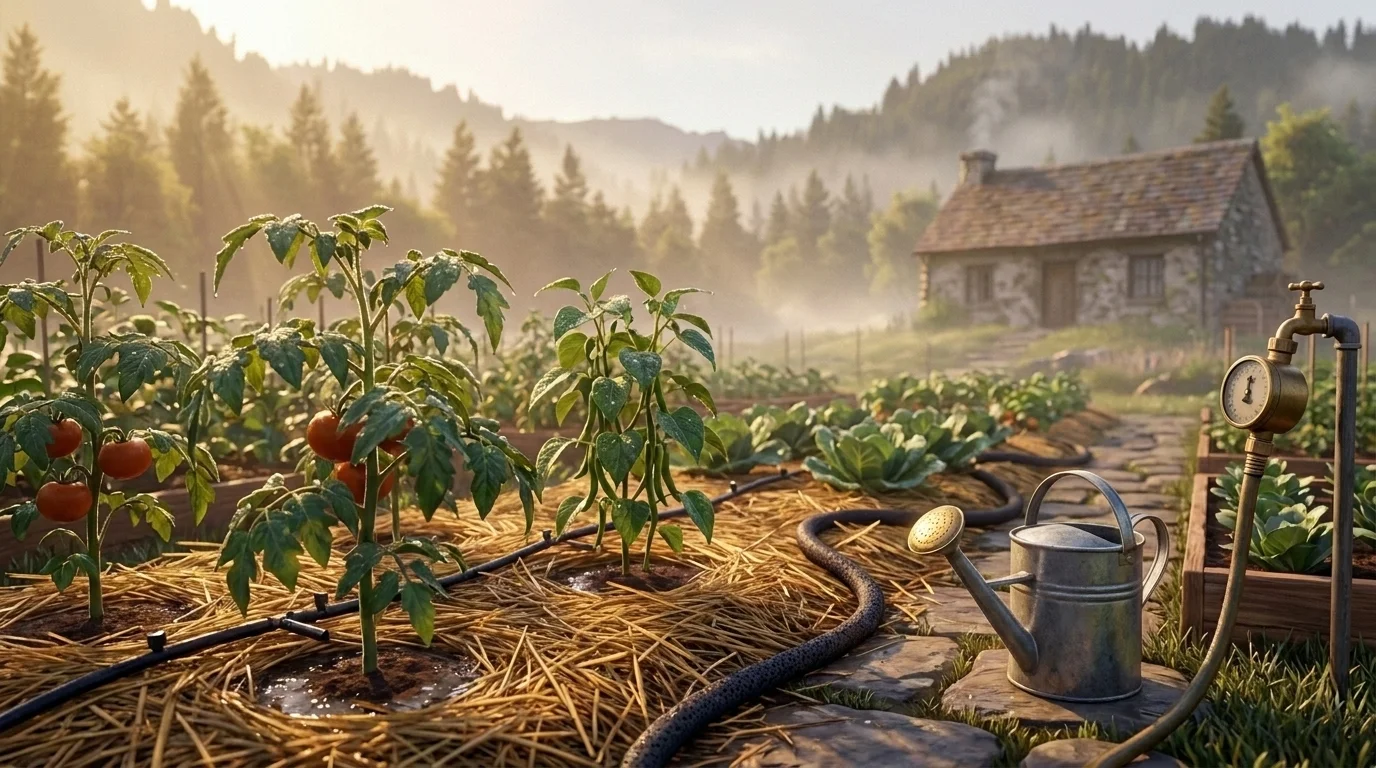
Drainage
From county records74% of the mapped acres across Appalachia are well drained — ground that drains quickly. That is area-weighted across all 299 of its mapped counties.
The upside is soil you can work early in spring and roots that never drown; the cost is that fast-draining ground dries out fast and leaches nutrients away before plants can use them.
Work in compost and mulch to hold moisture and feed, and water more often in short doses than deep and rarely.
USDA NRCS SSURGO
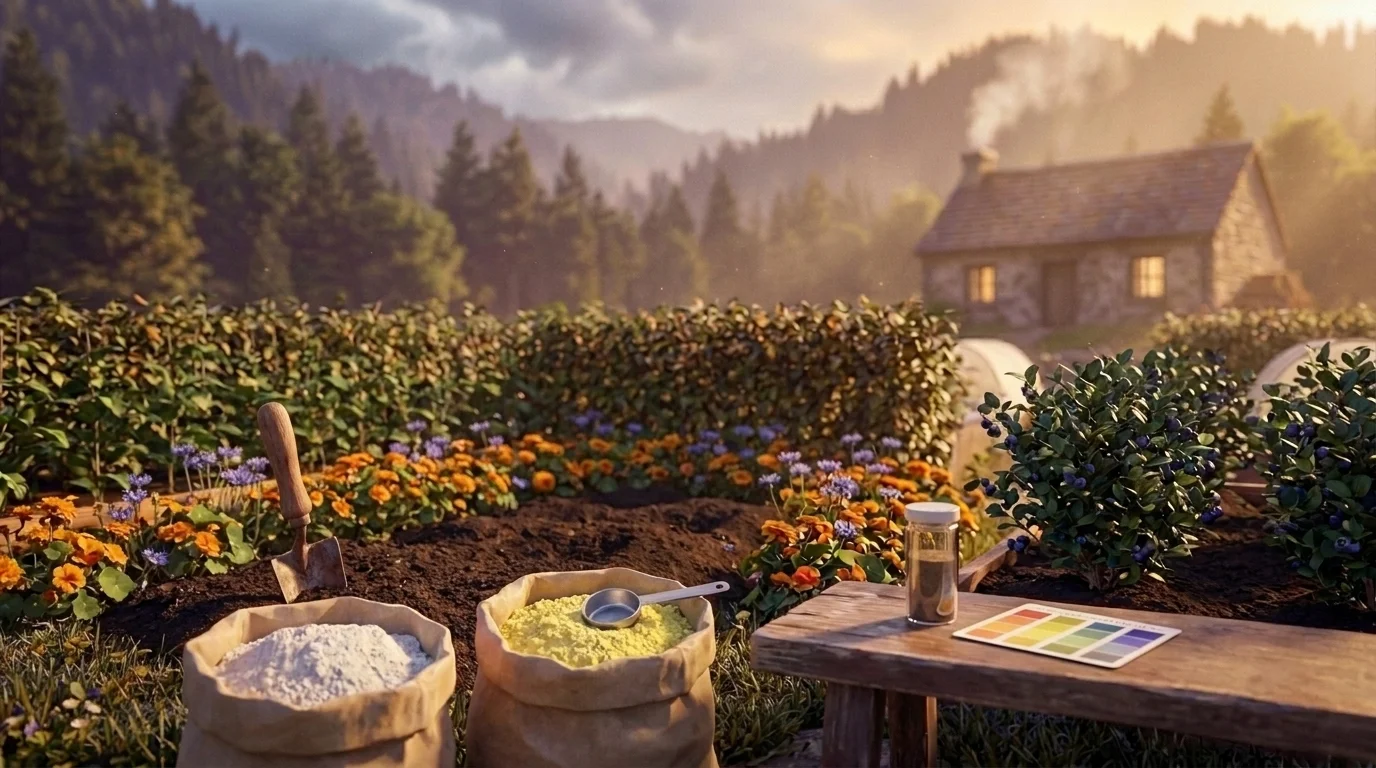
Surface pH
From county recordsTopsoil across Appalachia runs pH 4.0–7.0 — acidic in 293 of its 299 counties.
Blueberries, potatoes, and rhododendrons thrive in it, but most vegetables start locking out nutrients below about pH 6.0 and grow pale and stunted no matter how much you feed them.
A measured lime application raises pH for the crops that need it — but test first, because the right rate depends on your own soil, not the county average.
USDA NRCS SSURGO
 Safe to Grow Here?
What the federal record shows across Appalachia — and how to grow with it.
Across Appalachia's 306 counties the federal record holds 112,745 documented sites, mostly Underground Storage Tanks (64,169), Brownfields (25,256) and Nitrate (13,519). The heaviest single county is Allegheny County, with 4,863.
That is a regional count, not a reading of any one lot — proximity to a documented site is information, not a diagnosis. Open the map outlined to Appalachia to see which records sit where you actually grow.
Sources Checked
Summed across the 306 counties in Appalachia

A note from Gnorman
What an experienced grower watches for around here
In and around Appalachia, CAFO runs higher than the national average — 1,000 sites across the 306 counties in Appalachia. It's not cause for alarm — it's worth knowing, and there's a sensible way to grow around it.
CAFO: CAFOs pose a different contamination profile than chemical sources.
Wash all produce consumed raw thoroughly, especially leafy greens grown near CAFOs.
Sources: EPA, USGS — 1.8M documented sites tracked nationwide across 8 federal source types.
Your land is one point inside Appalachia
Everything above resolves to Appalachia as a whole — a footprint whose own counties record seasons 125 days apart, and hardiness across zones 5b-8b. Your parcel sits at one point in that range, not in the middle of it. Slope, tree cover, a low spot that pools cold air, and what is in the soil are all resolved at the address, and none of them are visible at region scale. That is the honest boundary of this page, and the reason the next step is a reading of your own ground rather than a better regional average.
Your Lot vs Appalachia Average
Appalachia Average
- ●USDA Zones 5b-8b, averaged across Appalachia
- ●One soil character for all of Appalachia
- ●State-average frost dates
YOUR Parcel
- ✓Your exact zone, not Appalachia's 5b-8b
- ✓Your SSURGO soil type & pH
- ✓Your sun exposure, cast in 3D
See MY Growing Report
Read your parcel in Appalachia
Pull a site-specific report for your exact address in Appalachia — soil, sun, drainage, frost risk, contamination, and scored plant recommendations.
Three things about your lot that Appalachia averages can't show:
We read public map data around Appalachia — soil, climate, flood, and parcel records. How we handle your address.
25+ data sources read at your address, not Appalachia average
How we know this about Appalachia
The boundary: an EPA Level III ecoregion (an area sharing climate, soils, and vegetation). Growing regions have no official boundary, so this footprint is our published one, and every figure on this page was measured over the counties inside it rather than borrowed from the state around it.
The datasets: hardiness from the USDA ARS Plant Hardiness Zone Map 2023, aggregated across the footprint; the growing season from NOAA Regional Climate Centers ACIS 1991–2020 28°F normals, read at each member’s own record; boundaries from US Census TIGER/Line 2025; the contamination record from the federal sources named in that beat above; the soil from the USDA NRCS SSURGO survey, read at each member county’s own record and weighted to this footprint by land area. Where a member carries no record of its own, it is absent from the figure rather than filled in.
Common questions about Appalachia
What hardiness zone is Appalachia?
Appalachia spans USDA hardiness zones 5b-8b, aggregated from the USDA Agricultural Research Service Plant Hardiness Zone Map 2023 across the region's counties. Zones reflect average annual extreme minimum temperatures from 1991–2020 data.
How long is the growing season in Appalachia?
Measured between 28°F hard freezes, Appalachia's counties mostly run 200 to 221 frost-free days, median 211 (NOAA Regional Climate Centers ACIS, 1991–2020, over 306 member counties). That 21-day spread is the honest read — no single season describes 306 counties, and each county guide below carries its own.
When does frost risk end in Appalachia?
Across Appalachia, the middle half of member counties see their last 28°F hard freeze between Mar 30 and Apr 11 (median Apr 5), and their first fall freeze between Oct 28 and Nov 7. Those are hard freezes, not the last light frost: tender transplants wait for about Apr 26, and elevation decides which end of a 12-day spread you garden in.
What grows well in Appalachia?
Appalachia's conditions suit plants such as Okra, Collard Greens, Tomato, Sweet Corn, Kale, Zucchini. What actually thrives on any one site still turns on its specific soil, sun, and drainage — we score each plant against the real conditions at your address.
How is Appalachia defined?
Appalachia's footprint follows an EPA Level III ecoregion — a boundary drawn where climate, soils, and vegetation actually change rather than where a state line falls. It covers 306 counties, and the counties linked on this page are representative of the region, not an exhaustive list.
Which states does Appalachia cover?
Appalachia spans Alabama, Georgia, Kentucky, Maryland, New Jersey, New York, North Carolina, Ohio, Pennsylvania, Tennessee, Virginia, and West Virginia. Each state's full growing guide is linked on this page.
What other growing regions cover the same states?
Piedmont, Mississippi Delta, Tidewater & Chesapeake, Ohio River Valley, Blue Ridge, and Gulf Coast share at least one state with Appalachia. Growing regions overlap and interlock — a single address can sit inside more than one, which is why the precise read is always the parcel, not the region.
What this page reads at Appalachia’s own scale
6 of the readings below were taken at Appalachia's own scale — the zone 5b-8b band across its footprint, a median 211-day season across its 306 counties and 112,745 documented federal contamination records across its 306 counties, 4,863 of them in Allegheny County alone; one is borrowed from a wider read, named and linked below.
Measured here
- The USDA hardiness band 5b-8b aggregated across all 306 counties in the footprintUSDA PHZM 2023
- The boundary itself — the EPA Level III ecoregion its 306 counties sit inside, drawn where climate and soils changeEPA Level III Ecoregions
- The growing character that makes this region distinct from the states it crossesGrowable Ground subregion registry
- The 28°F season across the footprint — the middle half of its 306 counties run 200 to 221 frost-free days, median 211NOAA Regional Climate Centers ACIS, 1991-2020
- The federal contamination record over the whole footprint — 112,745 documented federal contamination records across its 306 counties, 4,863 of them in Allegheny County aloneEPA, USGS and USDA federal site records
- The soil order mix across the footprint — 47% Ultisols, topsoil pH 4.0–7.0, area-weighted across its 299 mapped countiesUSDA NRCS SSURGO
Inherited from a wider read
- The candidate plant list — all 12 member states' curated sets, merged and filtered to zones 5b-8bfrom Alabama, Georgia, Kentucky, Maryland, New Jersey, New York, North Carolina, Ohio, Pennsylvania, Tennessee, Virginia and West Virginia
What this page can’t tell you
- Which end of the 21-day range your ground sits at — 200 days at one extreme, 221 at the other, decided mostly by elevationfrost dates explained →
- Which of those soils your own ground sits on — the survey maps them county-wide, and they change across a drivewaysoil types explained →
- The soil pH, drainage, sun hours, and frost pockets on one specific lotwhy one lot differs from the next →
Explore Appalachia
State growing guides
Representative counties
Other growing regions across Alabama, Georgia, Kentucky, Maryland, New Jersey, New York, North Carolina, Ohio, Pennsylvania, Tennessee, Virginia, and West Virginia
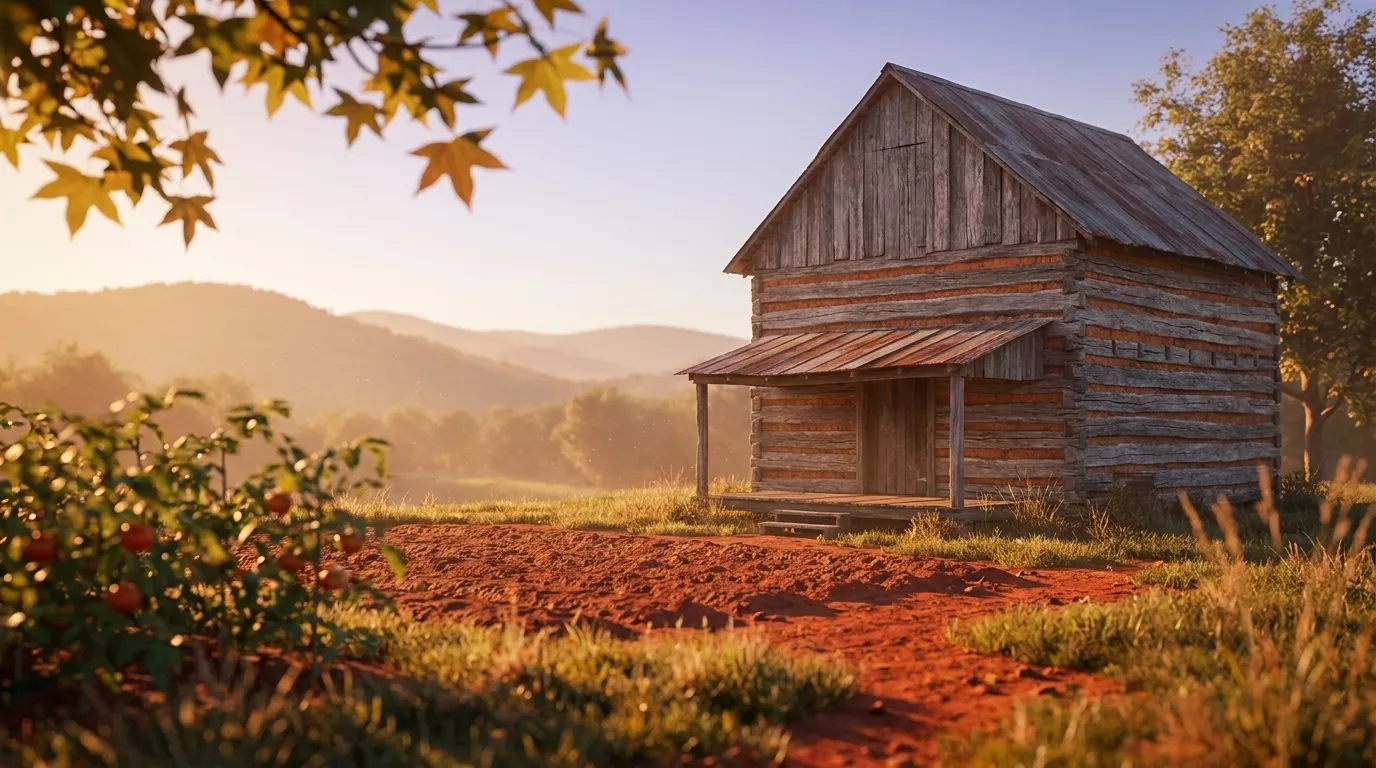
The rolling foothill belt between the Appalachians and the coastal plain, defined by heavy red clay soils that reward amendment and drainage. (Southern Piedmont; the Northern Piedmont is a separate ecoregion.)
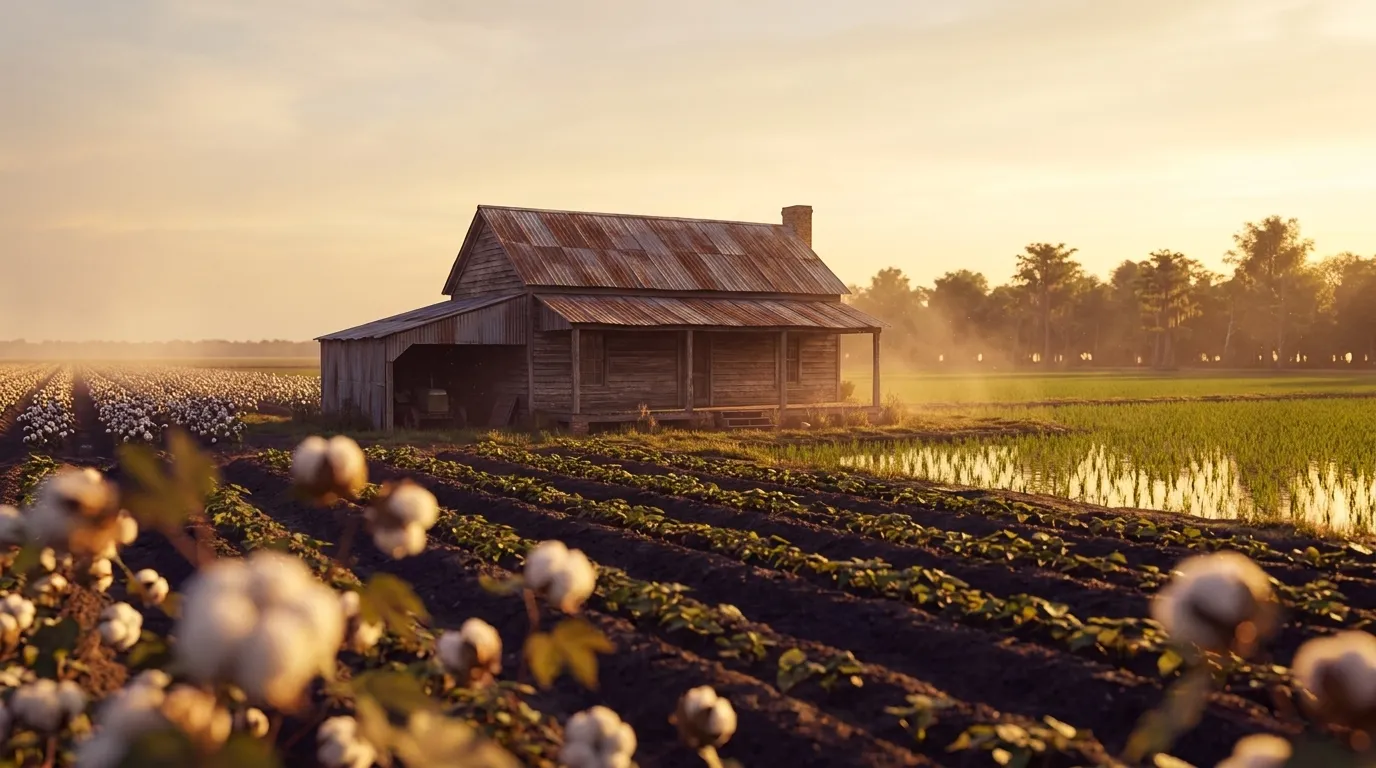
The flat, deep, dark alluvial bottomland of the lower Mississippi River — extraordinarily fertile cotton, soybean, rice, and sweet-potato ground.
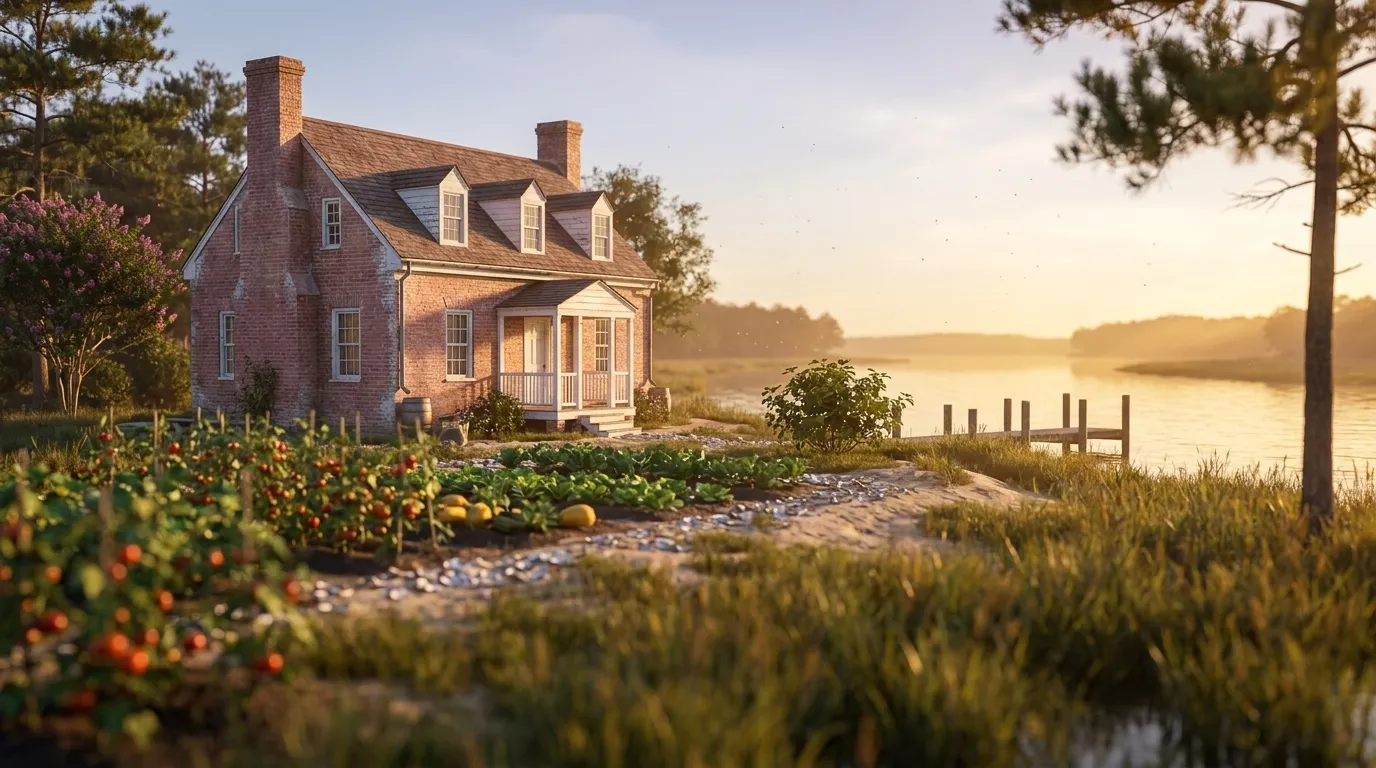
The low, flat, tidal coastal plain around Chesapeake Bay — sandy soils, mild maritime winters, and a long season for vegetables and Southern staples.
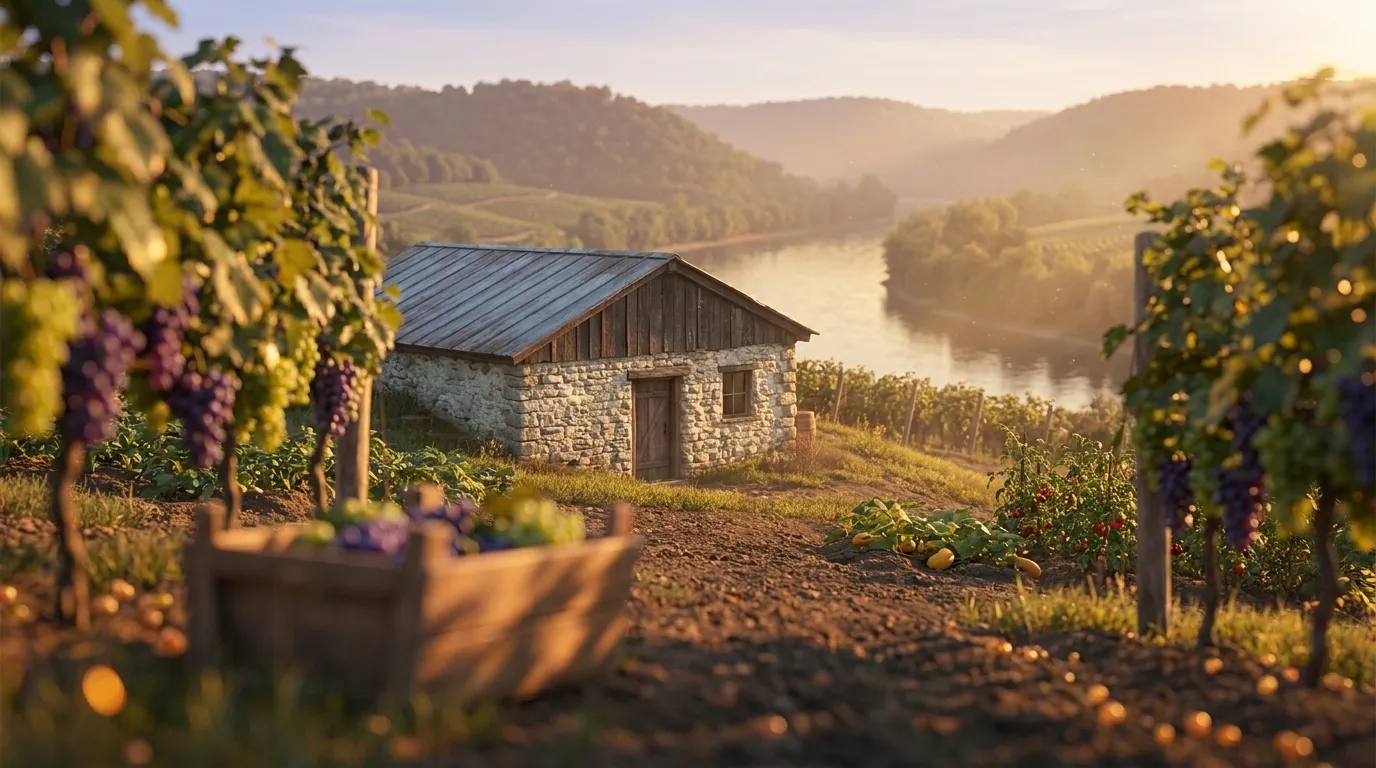
The warm river ribbon threading three states. The Ohio River's moderating flow gives its frontage counties a longer, milder season (zones 6a-7a, ~221 frost-free days) than the colder uplands just inland — a distinct corridor, not the surrounding hill country. It is also historic American wine country: the Ohio River Valley is a federally recognized winegrowing appellation (TTB AVA, 27 CFR §9.78), and its silty bottomland terraces still favor grapes and river-valley vegetables.
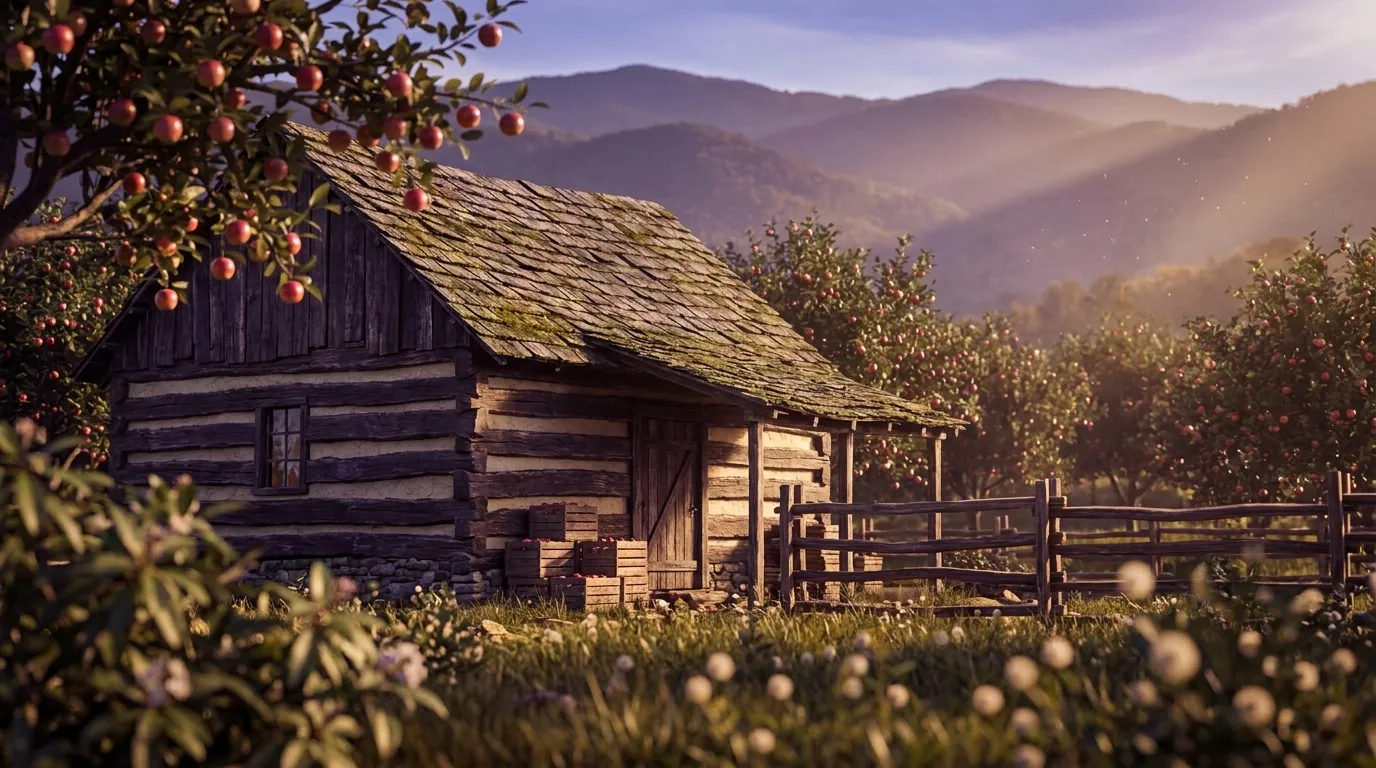
The high, cool, forested spine of the southern Appalachians — layered ridges, acidic mountain loams, and a short upland season suited to apples and cold-hardy crops.
The humid, near-frost-free coastal rim of the Gulf of Mexico — long seasons, sandy and alluvial soils, heat, and hurricanes shaping what thrives. (Representative coastal counties, not exhaustive.)