
The Homestead & the Redland spans USDA hardiness zones 10b-11a — enough range to grow cool-season vegetables, hardy fruit, and warm-season crops that mature before the first hard frost.
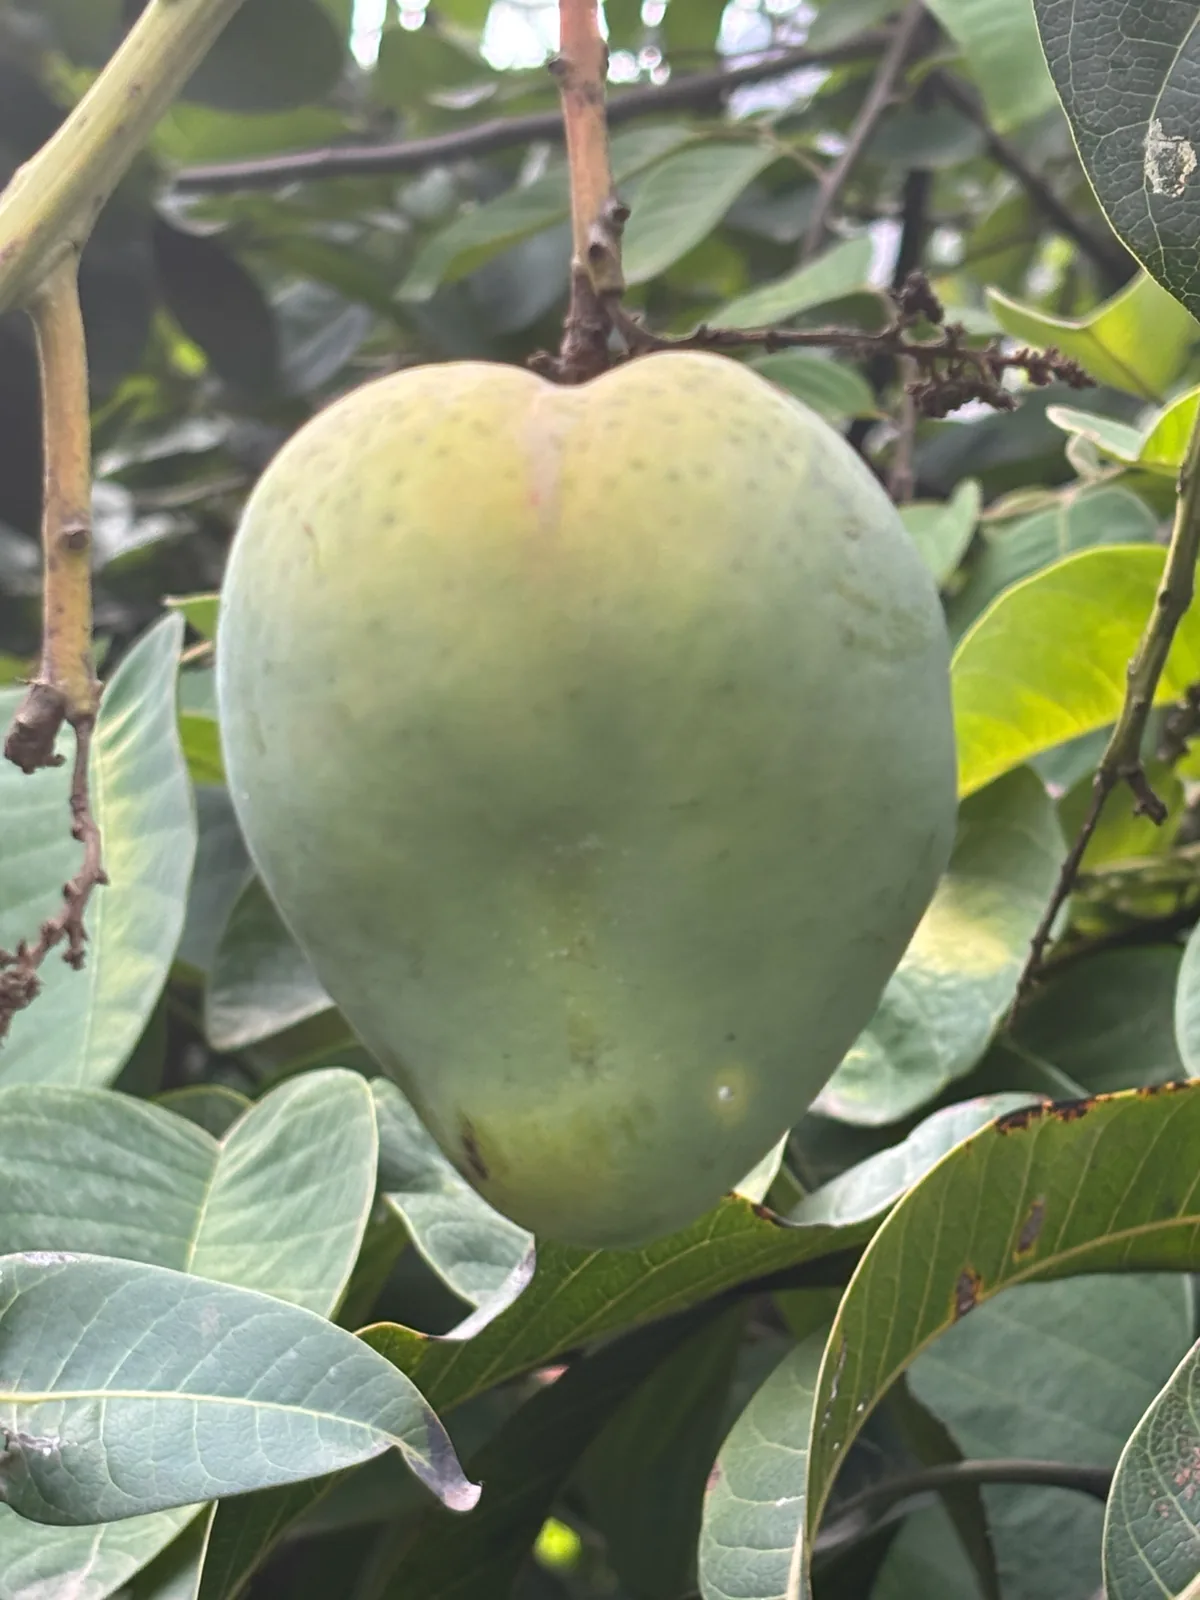
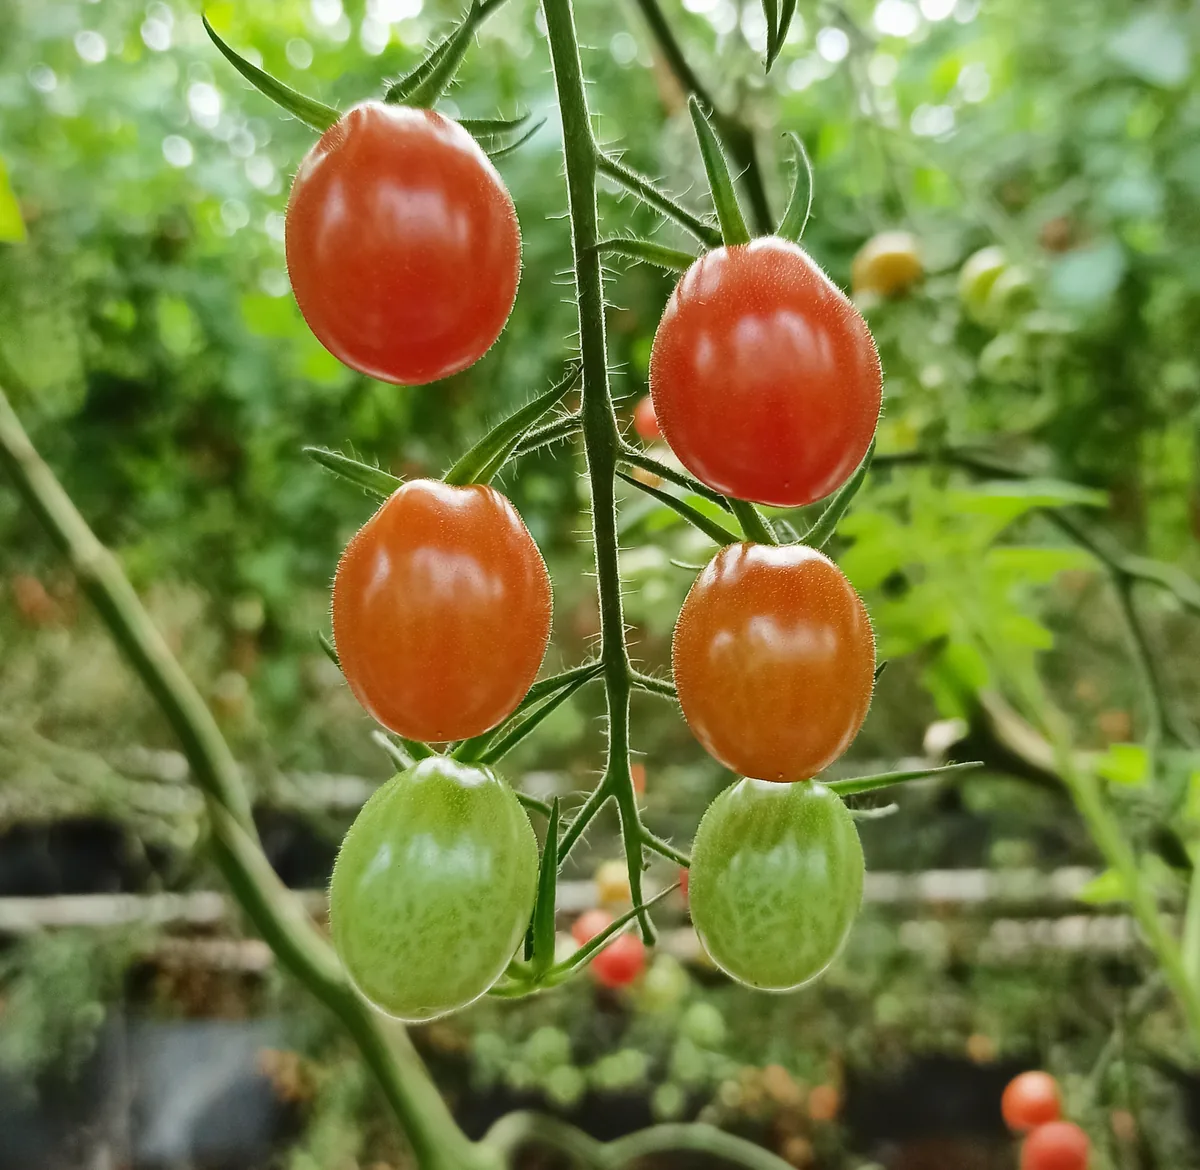
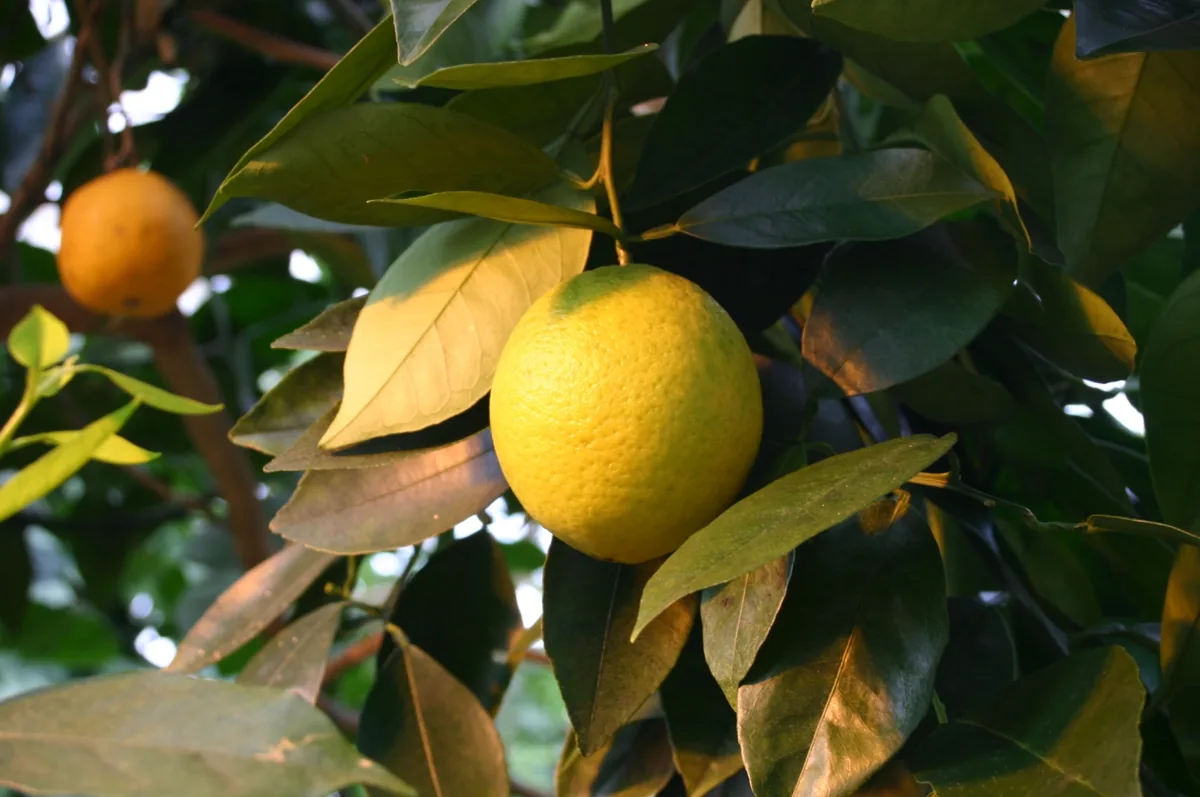
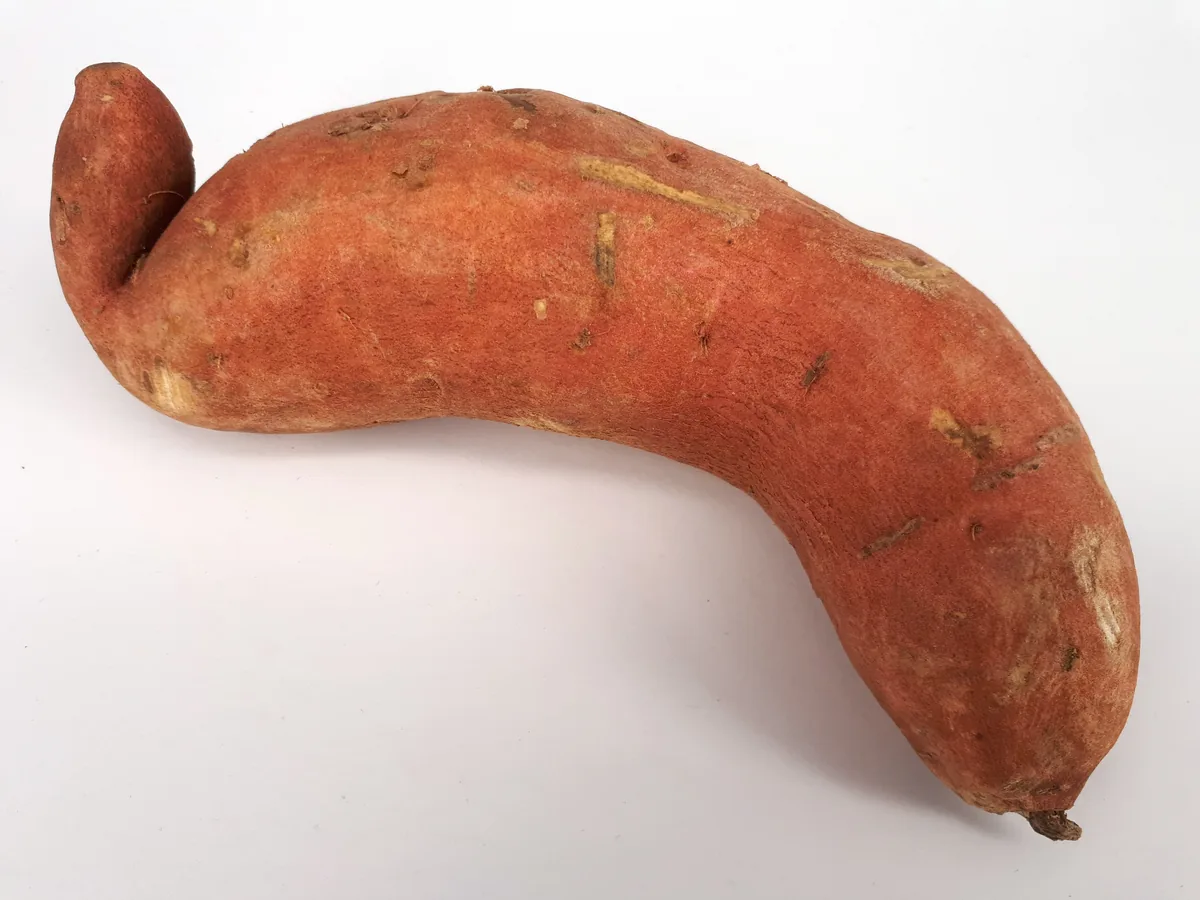
Miami-Dade's tropical-fruit district — the Redland's oolite ground grows mango, avocado, and lychee at commercial scale on a 10b-11a band; frost-free like the Keys, a half-zone warmer at its heart, and on farmable land the islands don't have. A short list that earns its place here — mango, tomato, orange, and sweet potato — with any one site's soil, sun, and drainage making the final cut.
The Homestead & the Redland spans Florida.
Your yard isn't all of the Homestead & the Redland.
The Homestead & the Redland spans USDA zones 10b-11a, but your parcel sits in exactly one — and slope, tree cover, and low spots nudge it further. Enter your address and we'll score 1,085 plants against your land's actual soil, sun, and frost.
We read public map data around Homestead & the Redland — soil, climate, flood, and parcel records. How we handle your address.
No card required · your parcel report in seconds — read in full free for your first 14 days
The Homestead & the Redland — the short answer
The Homestead & the Redland: USDA zones 10b-11a, 365 frost-free days, in Florida.
- USDA zones
- 10b-11a
- USDA PHZM 2023, aggregated over the footprint
- Frost-free season
- 365 days
- NOAA Regional Climate Centers ACIS, 1991–2020
- Towns
- 6
- US Census TIGER/Line 2025
- Region type
- Town cluster
- Growable Ground growing-region registry
Region boundary: Growable Ground growing-region registry — curated county clusters, EPA Level III ecoregions, and town clusters drawn finer than any county. Where a region publishes no measured season, no season figure is shown.
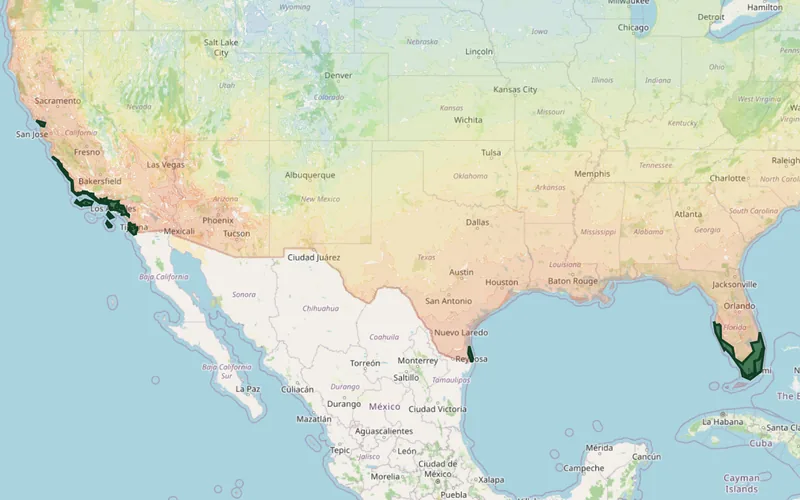
What Grows in the Homestead & the Redland
Plants matched to the Homestead & the Redland's USDA zones 10b-11a, ordered by how much hardiness margin each has across the region — the ones with room to spare at both ends of this band lead. Each links to its full growing profile.
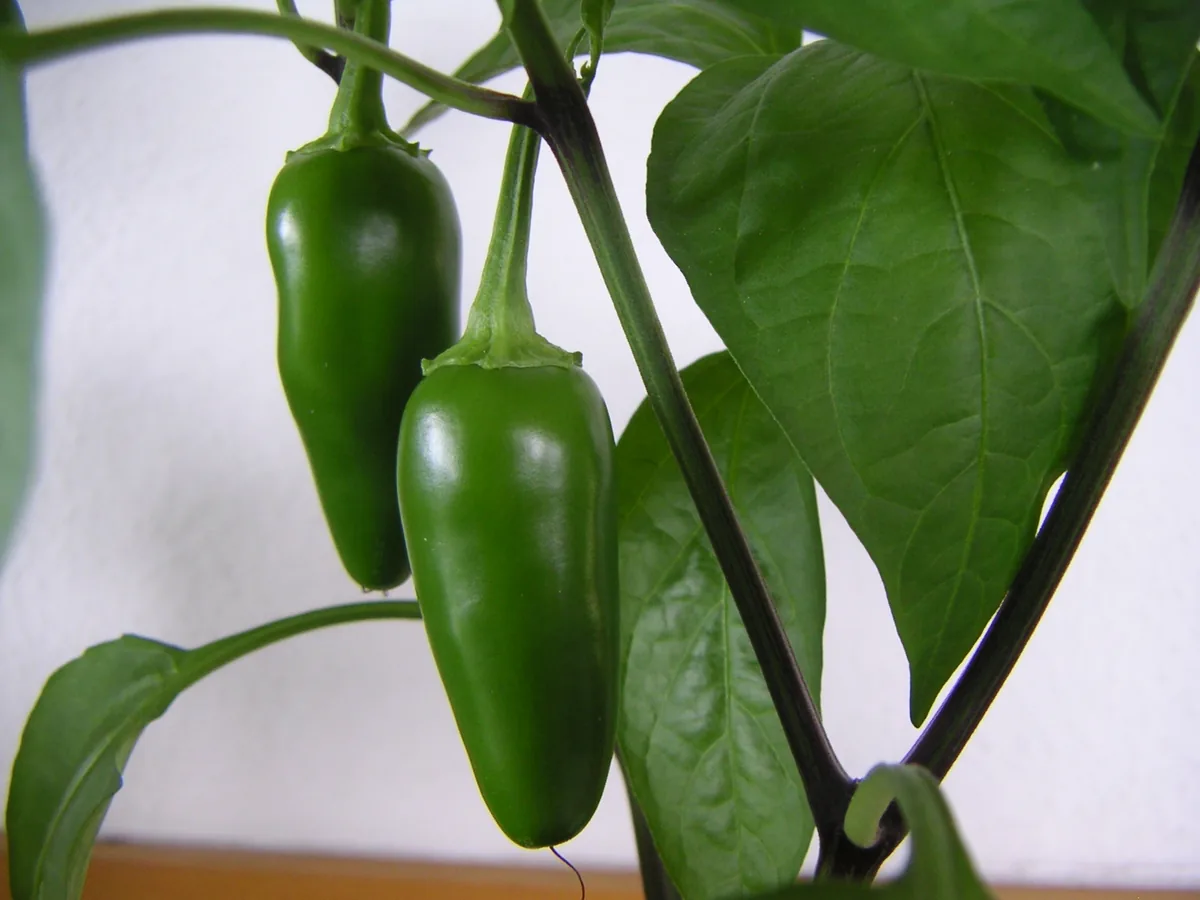
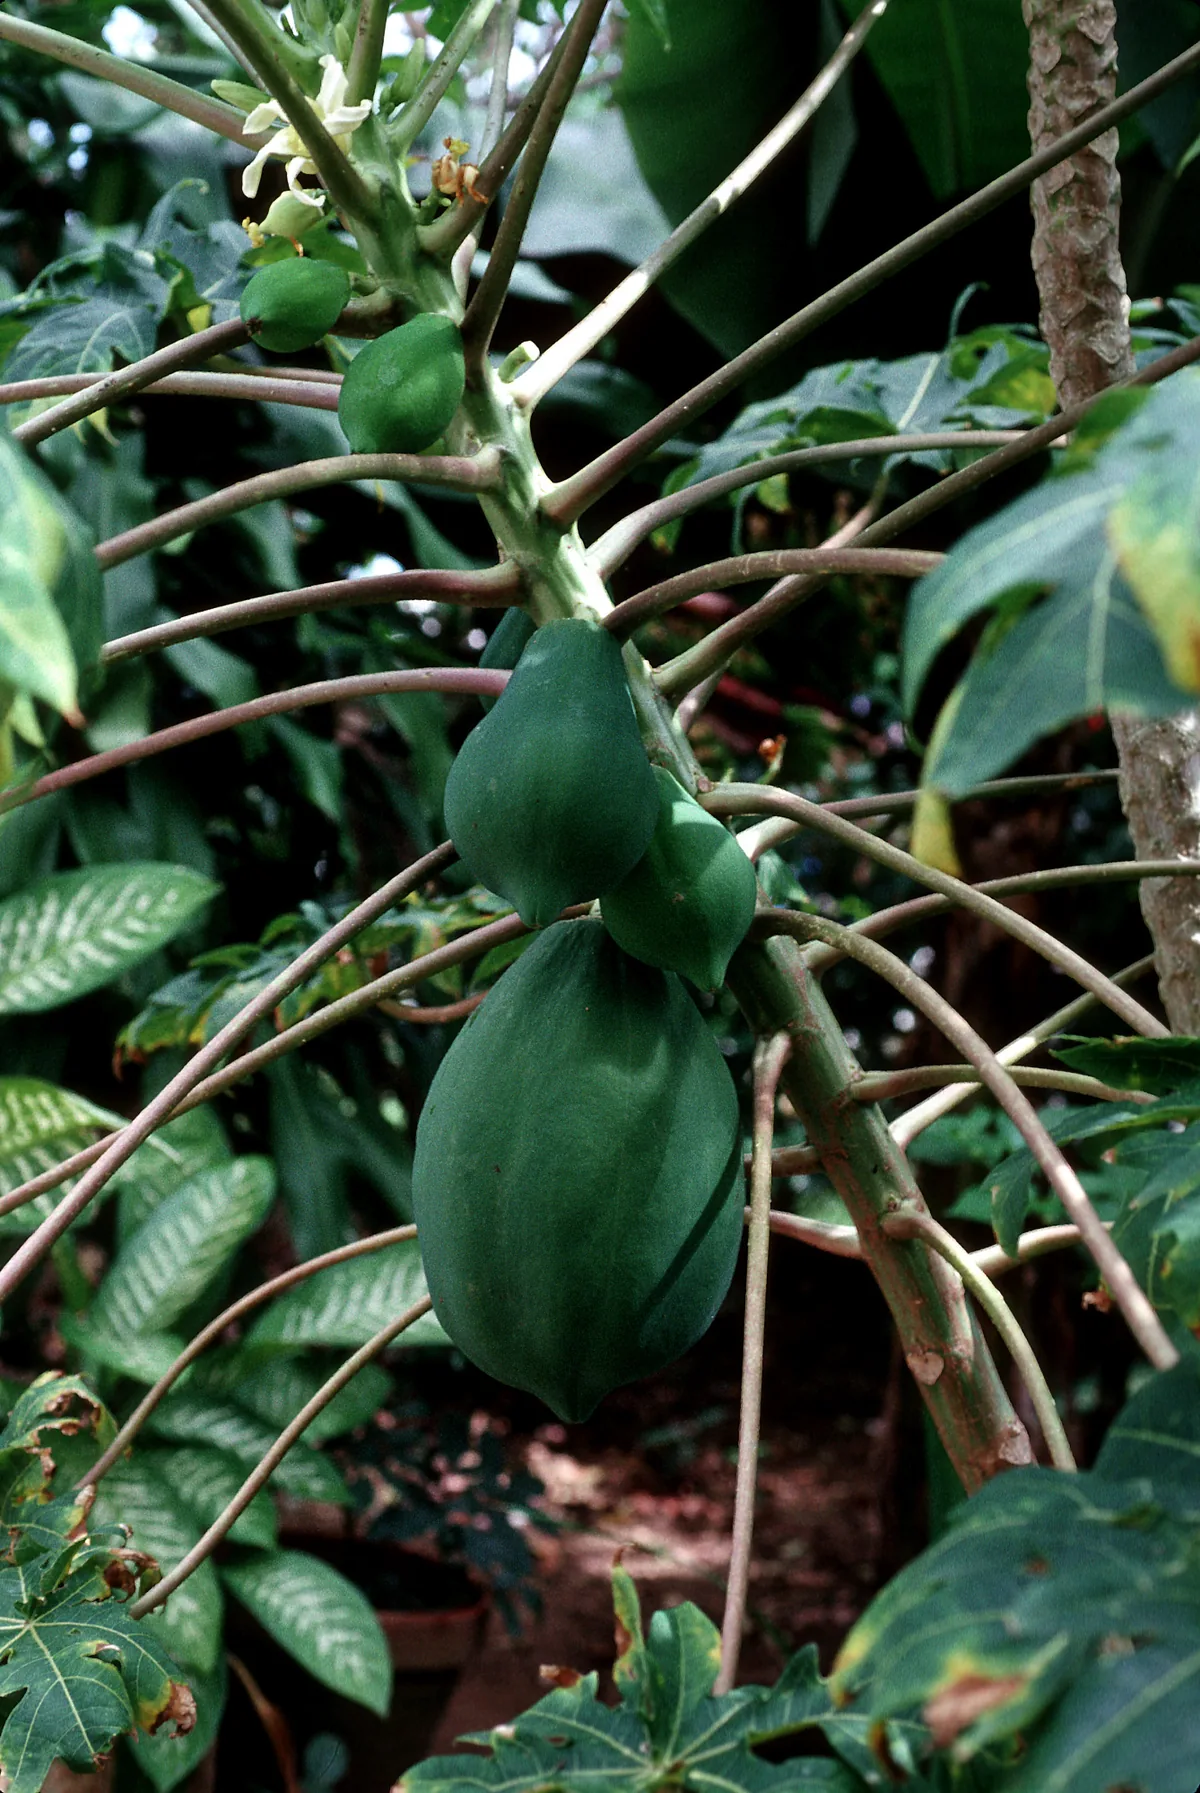
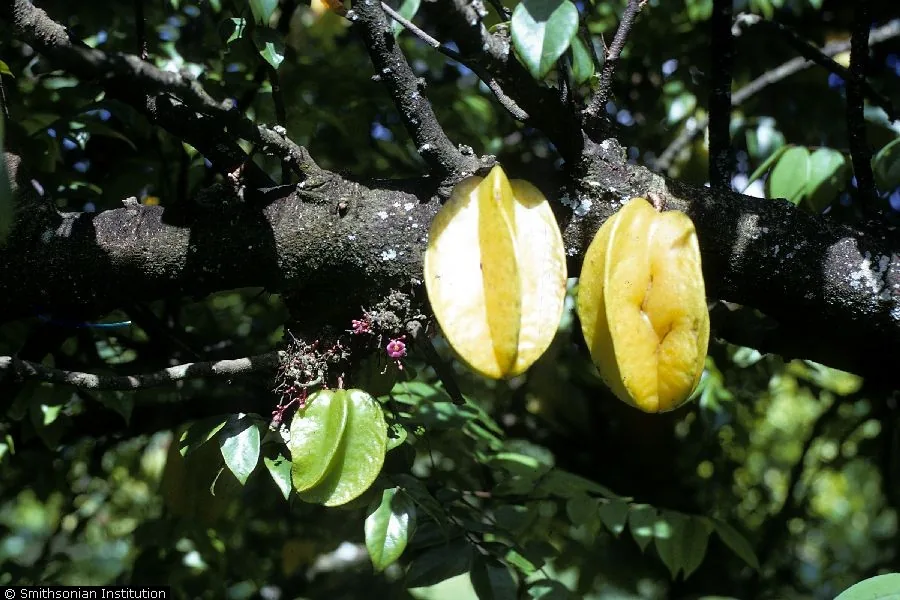
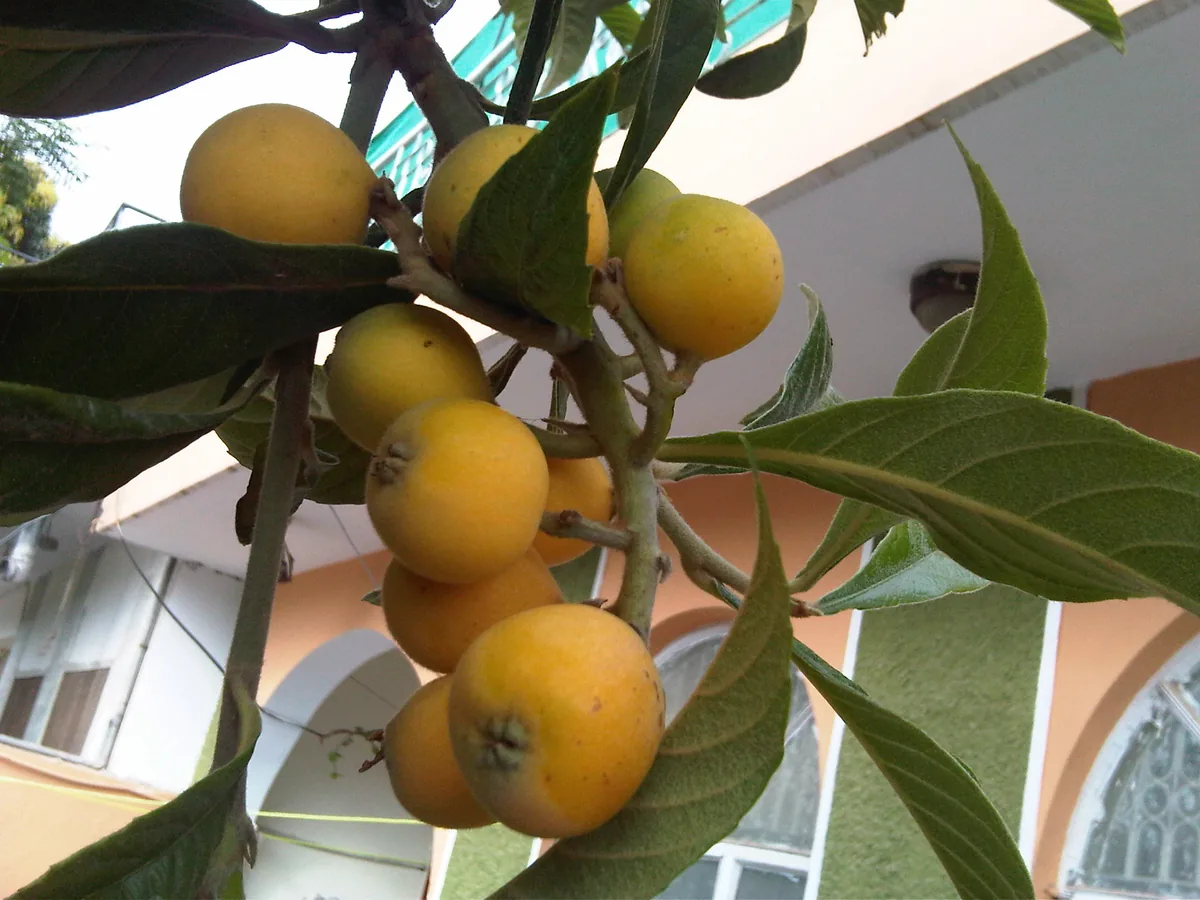
Native Plants of the Homestead & the Redland
Plants the USDA PLANTS Database documents as native and present in this region’s state, kept only where the published hardiness range meets the Homestead & the Redland’s USDA zones 10b-11a — closest range match first. Presence is recorded by state, so a plant can be documented across the state and still be scarce in your corner of the region.
The ground around the Homestead & the Redland
The USDA soil survey maps this ground county by county. These are those records weighted by land area across the county containing the Homestead & the Redland — the ground the Homestead & the Redland sits in, read at the only grain the survey publishes.
In the county containing the Homestead & the Redland, the ground is predominantly Entisols, at 55% of mapped acres, followed by Histosols (30%) and Mollisols (15%). Five soil orders appear in that record, which is the honest reason a regional soil answer only goes so far. The most extensive named soils are Biscayne, Krome, and Perrine.
41% of those acres are very poorly drained, and another 10% moderately well drained, 9% somewhat poorly drained. Topsoil pH runs 7.0–8.0 in that county’s own record.
Soil order
Entisols
Drainage
Very poorly drained
Topsoil pH
7.0–8.0
Hydric soils
69%
Soil changes across a driveway, so which of these your own ground sits on is a parcel question rather than a regional one. soil types explained.
USDA NRCS SSURGO via Soil Data Access

What this means for growing in the Homestead & the Redland
The soil survey reads this ground county by county, and the readings above are the record for the county containing the Homestead & the Redland. Here is what they mean for a garden here — and the move an experienced grower makes about each one.
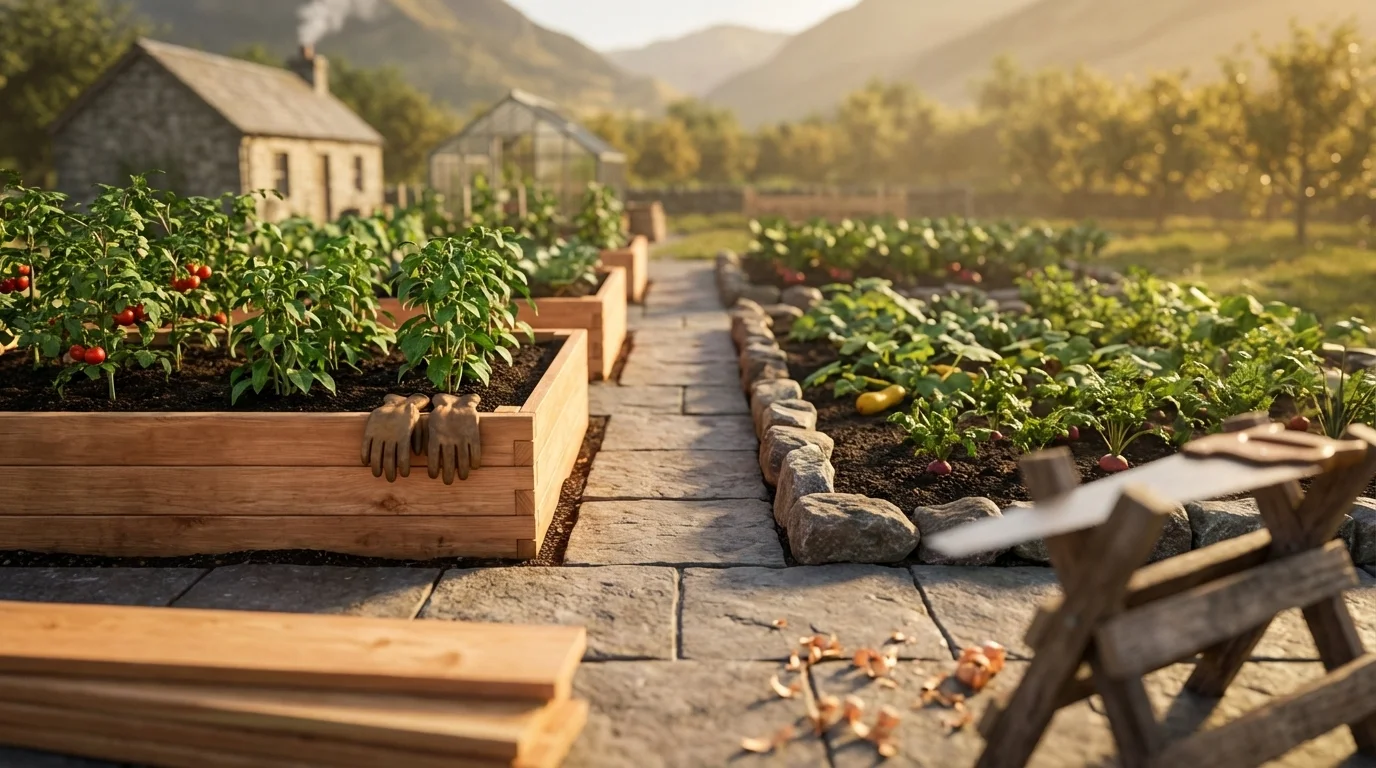
Drainage
From county records41% of the mapped acres across the county containing the Homestead & the Redland are very poorly drained — ground that sheds water slowly. The survey maps this ground county-wide, so it describes the setting the Homestead & the Redland sits in rather than the valley floor alone.
Beds can stay saturated for days after heavy rain, and the roots of most vegetables, berries, and fruit trees suffocate or rot in soil that never drains.
Raised beds or mounded rows lift roots above the wet zone; choose water-tolerant crops for the lowest spots.
USDA NRCS SSURGO
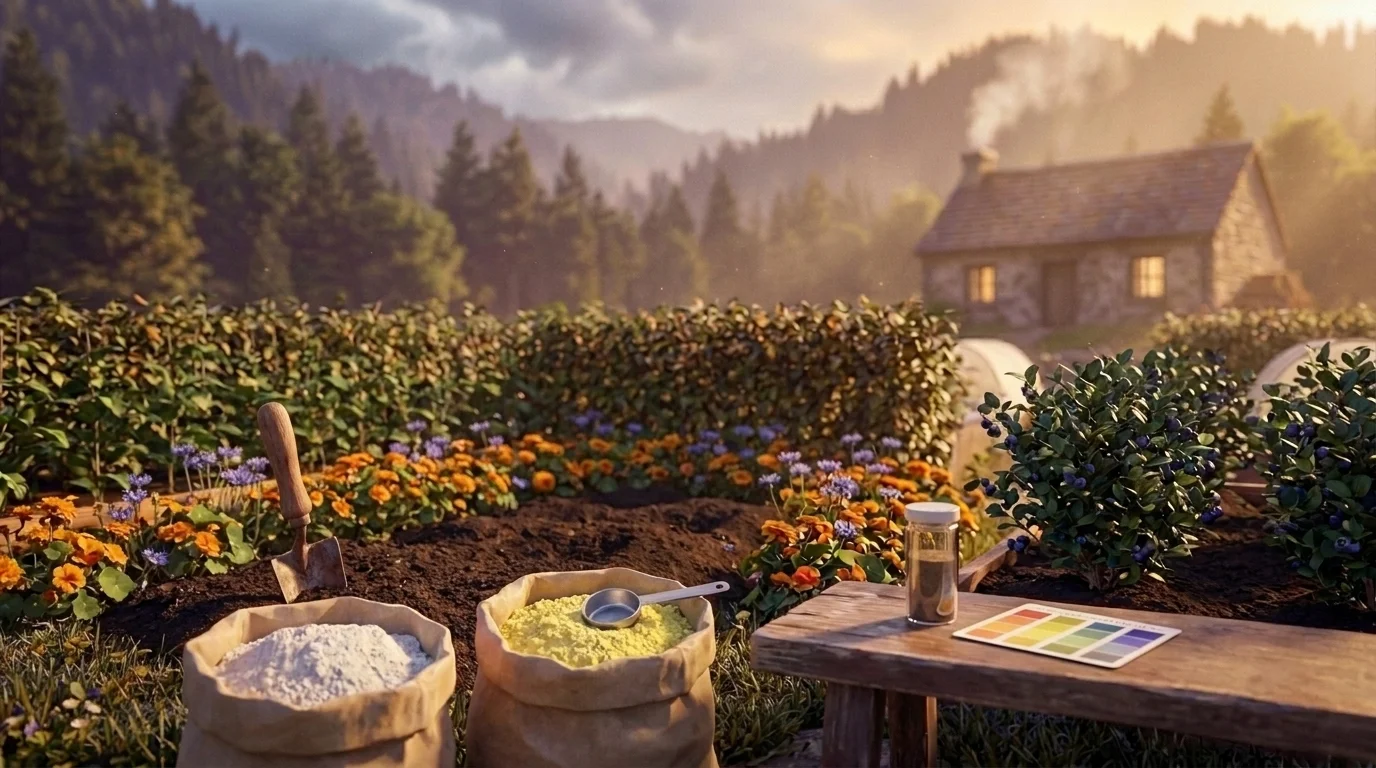
Surface pH
From county recordsTopsoil across the county containing the Homestead & the Redland runs pH 7.0–8.0 — alkaline in the one record covering it.
Many vegetables cope, but acid-lovers like blueberries struggle, and iron and manganese lock up above about pH 7.5 — leaves yellow between the veins even in rich soil.
Elemental sulfur and generous organic matter lower pH slowly for the beds that need it; test first so you add only what the soil actually calls for.
USDA NRCS SSURGO
 Safe to Grow Here?
What the federal record shows across the Homestead & the Redland — and how to grow with it.
Across Miami-Dade County, which contains the Homestead & the Redland, the federal record holds 7,683 documented sites, mostly Underground Storage Tanks (3,455), Brownfields (2,672) and Nitrate (1,282).
That is the containing county's count — this region is a smaller piece of that ground, so it is context, not a reading of any one lot. Open the map outlined to the Homestead & the Redland to see which records sit where you actually grow.
Sources Checked
Summed across the county containing the Homestead & the Redland
Know Before You Grow
- •Underground tanks leak petroleum as they age — near a former filling station, test the soil.
- •Near a brownfield, raised beds of imported soil give your food clean ground.
- •On a private well, test for nitrates: above 10 mg/L the water needs treatment before irrigating.
Sources: EPA, USGS — 1.8M documented sites tracked nationwide across 8 federal source types.
Your land is one point inside the Homestead & the Redland
Everything above resolves to the Homestead & the Redland as a whole — a footprint spanning USDA zones 10b-11a. Your parcel sits in exactly one of them. Slope, tree cover, a low spot that pools cold air, and what is in the soil are all resolved at the address, and none of them are visible at region scale. That is the honest boundary of this page, and the reason the next step is a reading of your own ground rather than a better regional average.
Your Lot vs the Homestead & the Redland Average
Homestead & the Redland Average
- ●USDA Zones 10b-11a, averaged across Homestead & the Redland
- ●One soil character for all of Homestead & the Redland
- ●State-average frost dates
YOUR Parcel
- ✓Your exact zone, not Homestead & the Redland's 10b-11a
- ✓Your SSURGO soil type & pH
- ✓Your sun exposure, cast in 3D
See MY Growing Report
Read your parcel in the Homestead & the Redland
Pull a site-specific report for your exact address in the Homestead & the Redland — soil, sun, drainage, frost risk, contamination, and scored plant recommendations.
Three things about your lot that Homestead & the Redland averages can't show:
We read public map data around The Homestead & the Redland — soil, climate, flood, and parcel records. How we handle your address.
25+ data sources read at your address, not the Homestead & the Redland average
How we know this about the Homestead & the Redland
The boundary: the region's own towns — a footprint finer than any county, because the county average would misread this microclimate. Growing regions have no official boundary, so this footprint is our published one, and every figure on this page was measured over the towns inside it rather than borrowed from the state around it.
The datasets: hardiness from the USDA ARS Plant Hardiness Zone Map 2023, aggregated across the footprint; the growing season from NOAA Regional Climate Centers ACIS 1991–2020 28°F normals, read at each member’s own record; boundaries from US Census TIGER/Line 2025; the contamination record from the federal sources named in that beat above; the soil from the USDA NRCS SSURGO survey, read at each member county’s own record and weighted to this footprint by land area. Where a member carries no record of its own, it is absent from the figure rather than filled in.
Common questions about the Homestead & the Redland
What hardiness zone is the Homestead & the Redland?
The Homestead & the Redland spans USDA hardiness zones 10b-11a, aggregated from the USDA Agricultural Research Service Plant Hardiness Zone Map 2023 across the region's own towns. Zones reflect average annual extreme minimum temperatures from 1991–2020 data.
What grows well in the Homestead & the Redland?
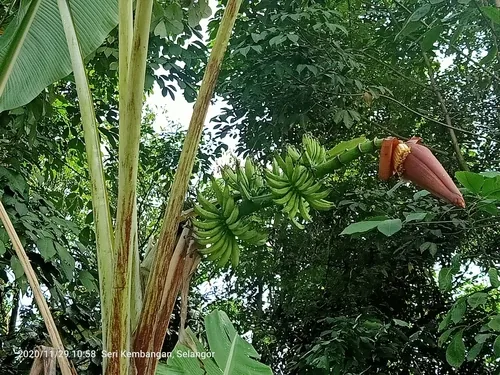
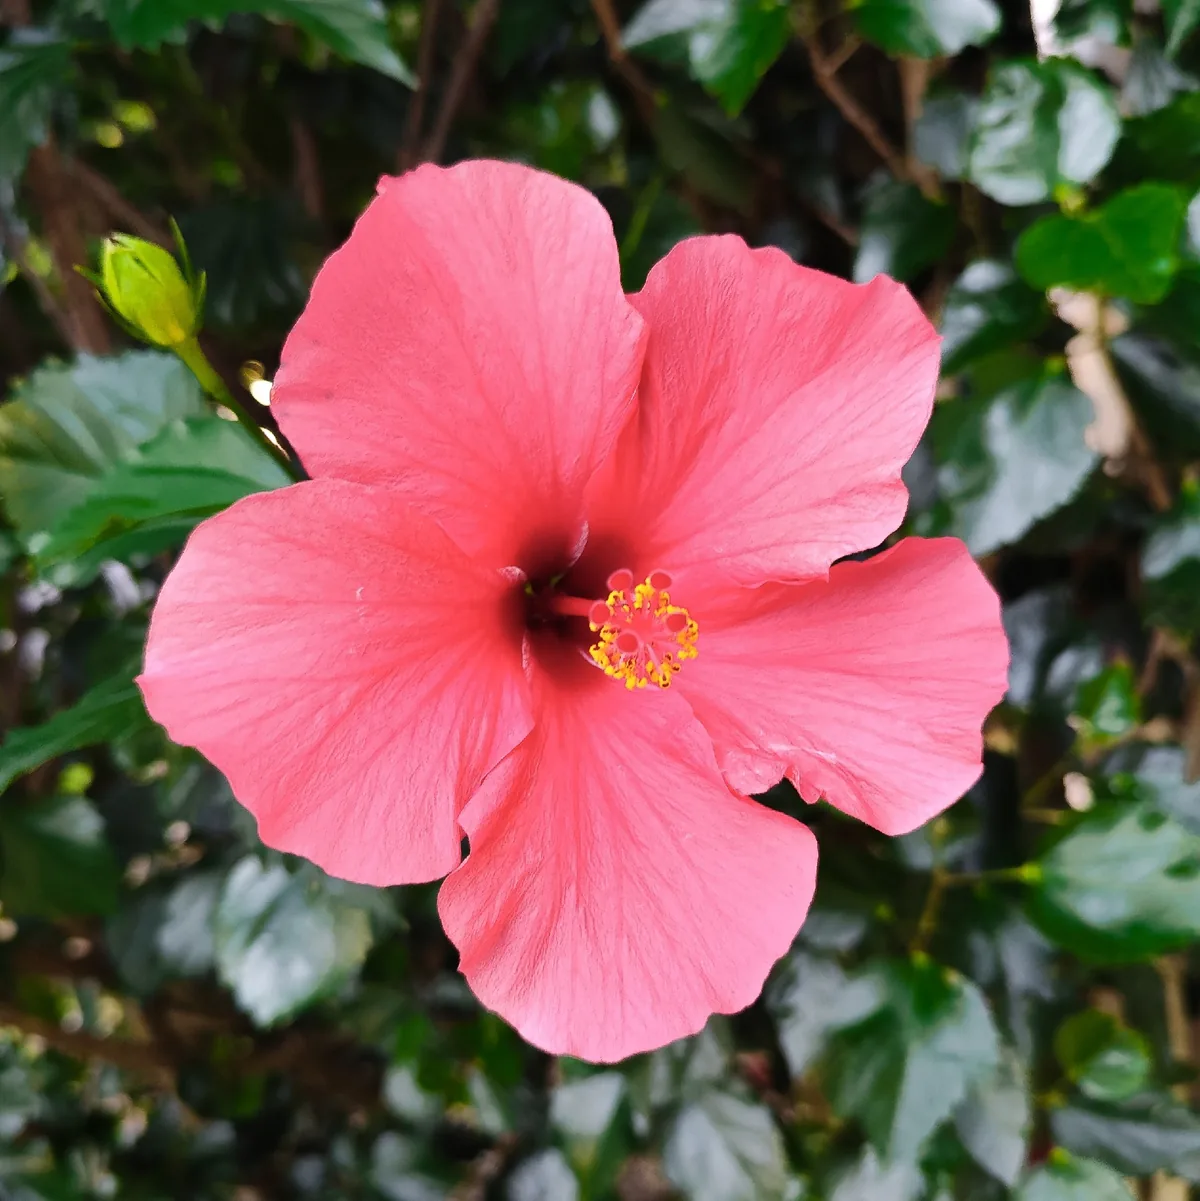
The Homestead & the Redland's conditions suit plants such as Mango, Tomato, Orange, Sweet Potato, Banana, Hibiscus. What actually thrives on any one site still turns on its specific soil, sun, and drainage — we score each plant against the real conditions at your address.
How is the Homestead & the Redland defined?
The Homestead & the Redland is a true microclimate — smaller than the county that contains it, with a growing reality of its own. So this page is built from the region's own 6 towns, each carrying its own hardiness zone and frost record, rather than from a county average measured somewhere else.
Which states does the Homestead & the Redland cover?
The Homestead & the Redland spans Florida. Each state's full growing guide is linked on this page.
What other growing regions cover the same states?
Gulf Coast, Florida Panhandle, Northeast Florida, Southwest Florida (Naples–Fort Myers–Sarasota), Central Florida Ridge, and Everglades Agricultural Area share at least one state with the Homestead & the Redland. Growing regions overlap and interlock — a single address can sit inside more than one, which is why the precise read is always the parcel, not the region.
What this page reads at the Homestead & the Redland’s own scale
5 of the readings below were taken at the Homestead & the Redland's own scale — the zone 10b-11a band across its footprint and 7,683 documented federal contamination records across its one county, 7,683 of them in Miami-Dade County alone; one is borrowed from a wider read, named and linked below.
Measured here
- The USDA hardiness band 10b-11a aggregated across all 6 towns in the footprintUSDA PHZM 2023
- The boundary itself — the 6 towns this region is curated fromGrowable Ground subregion registry
- The growing character that makes this region distinct from the states it crossesGrowable Ground subregion registry
- The federal contamination record over the whole footprint — 7,683 documented federal contamination records across its one county, 7,683 of them in Miami-Dade County aloneEPA, USGS and USDA federal site records
- The soil order mix across the footprint — 55% Entisols, topsoil pH 7.0–8.0, area-weighted across its one mapped countyUSDA NRCS SSURGO
Inherited from a wider read
- The candidate plant list — its state's curated sets, merged and filtered to zones 10b-11afrom Florida
What this page can’t tell you
- Frost dates — they swing too far across a footprint this size to quote as one regional numberfrost dates explained →
- Which of those soils your own ground sits on — the survey maps them county-wide, and they change across a drivewaysoil types explained →
- The soil pH, drainage, sun hours, and frost pockets on one specific lotwhy one lot differs from the next →
Explore the Homestead & the Redland
State growing guides
Towns in this region
The county containing this region
Other growing regions across Florida
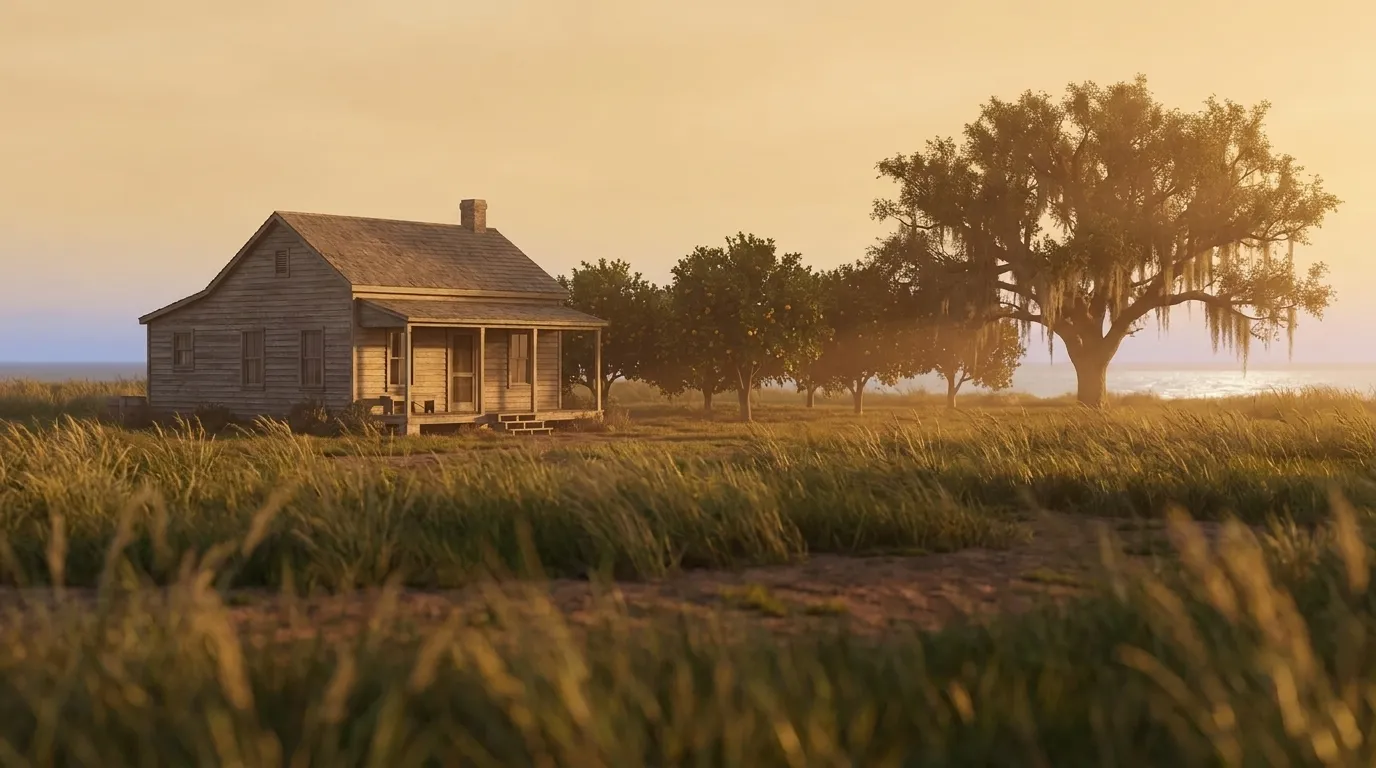
The humid, near-frost-free coastal rim of the Gulf of Mexico — long seasons, sandy and alluvial soils, heat, and hurricanes shaping what thrives. (Representative coastal counties, not exhaustive.)
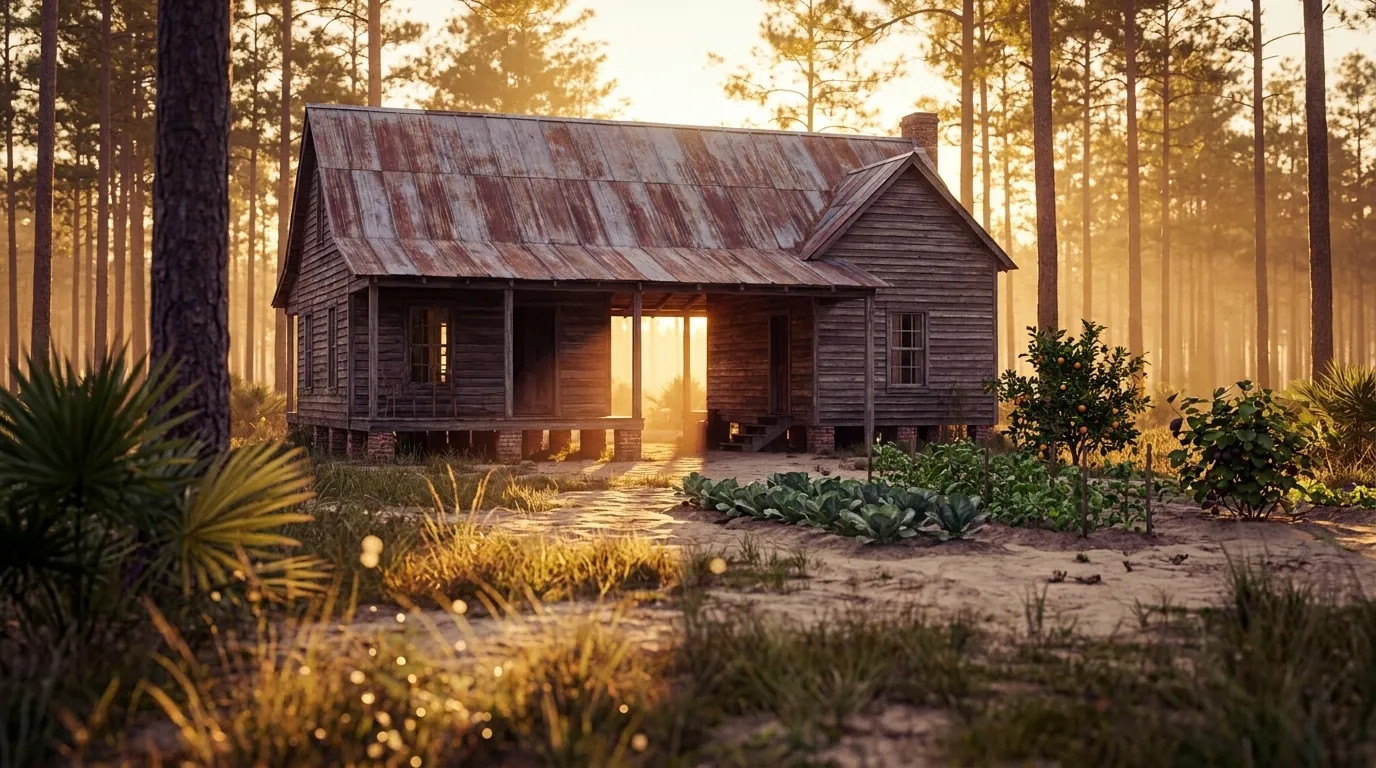
North Florida's mild-winter coastal plain of sandy and clay soils — a transition zone growing both Southern staples and subtropical fruit.
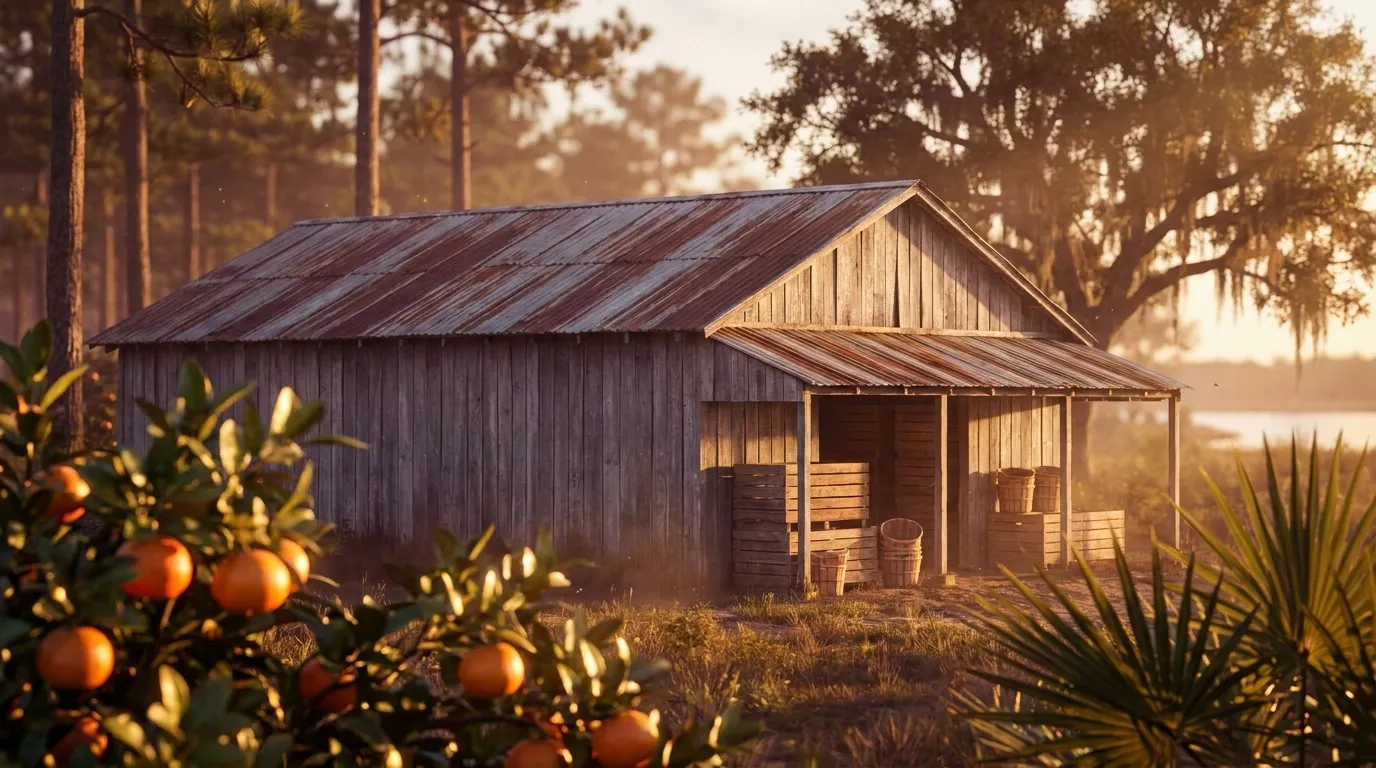
The Atlantic-facing northeast peninsula — Jacksonville, Gainesville, and St. Augustine along the St. Johns River — where ocean-moderated Zone 9a–9b winters and deep sandy coastal-plain flatwoods set a warmer floor and a tighter, earlier frost window than the Gulf-side Panhandle to the west (no genuine 8b interior here; last frost lands ~late January to mid-February).
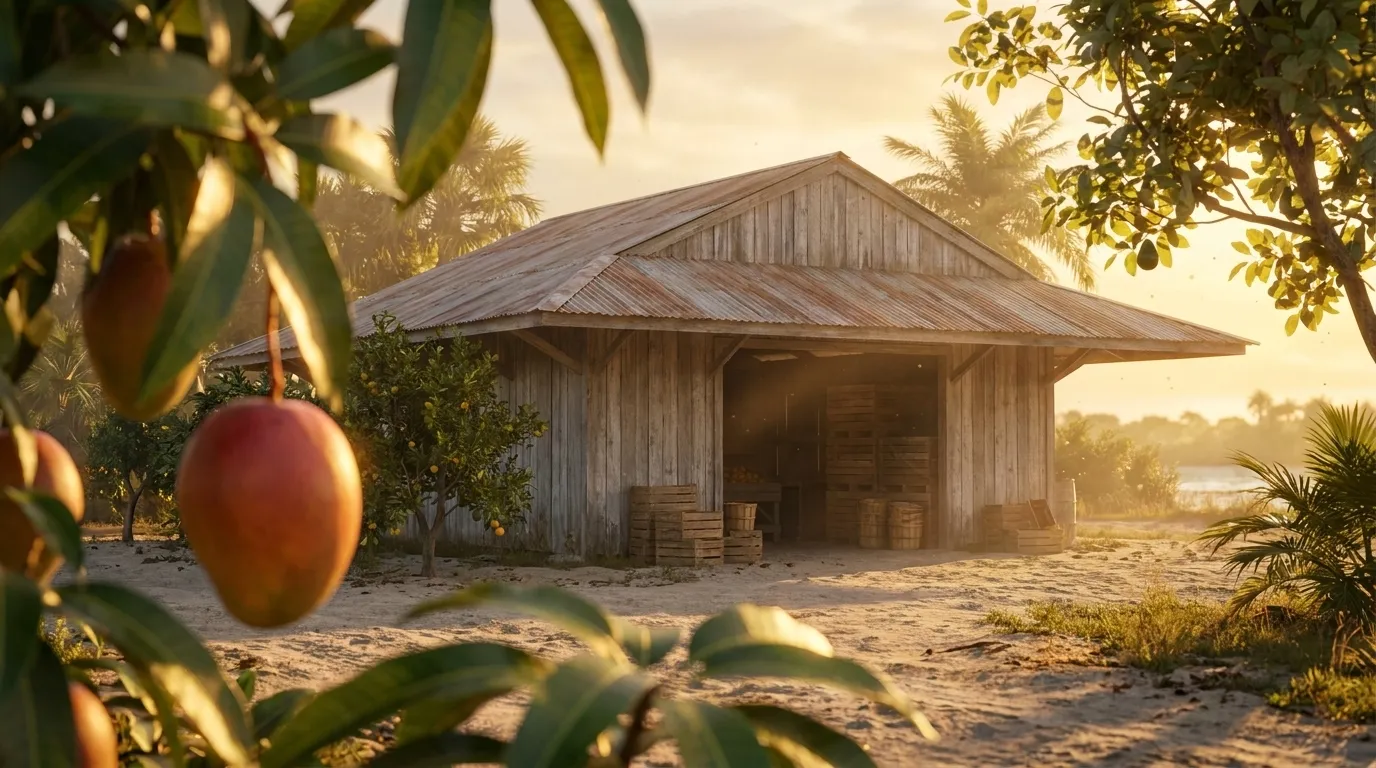
Florida's lower Gulf coast — a near-frost-free subtropical corridor (USDA zone 10a–10b along the shore, dropping to 9b in the DeSoto interior) where mangrove shorelines, sandy and marl soils, and hurricane exposure shape what grows. Year-round warm-season vegetables and mainland tropical fruit thrive here on a Gulf-side footprint distinct from both the cooler Central Florida interior and the Atlantic shore at the same latitude.
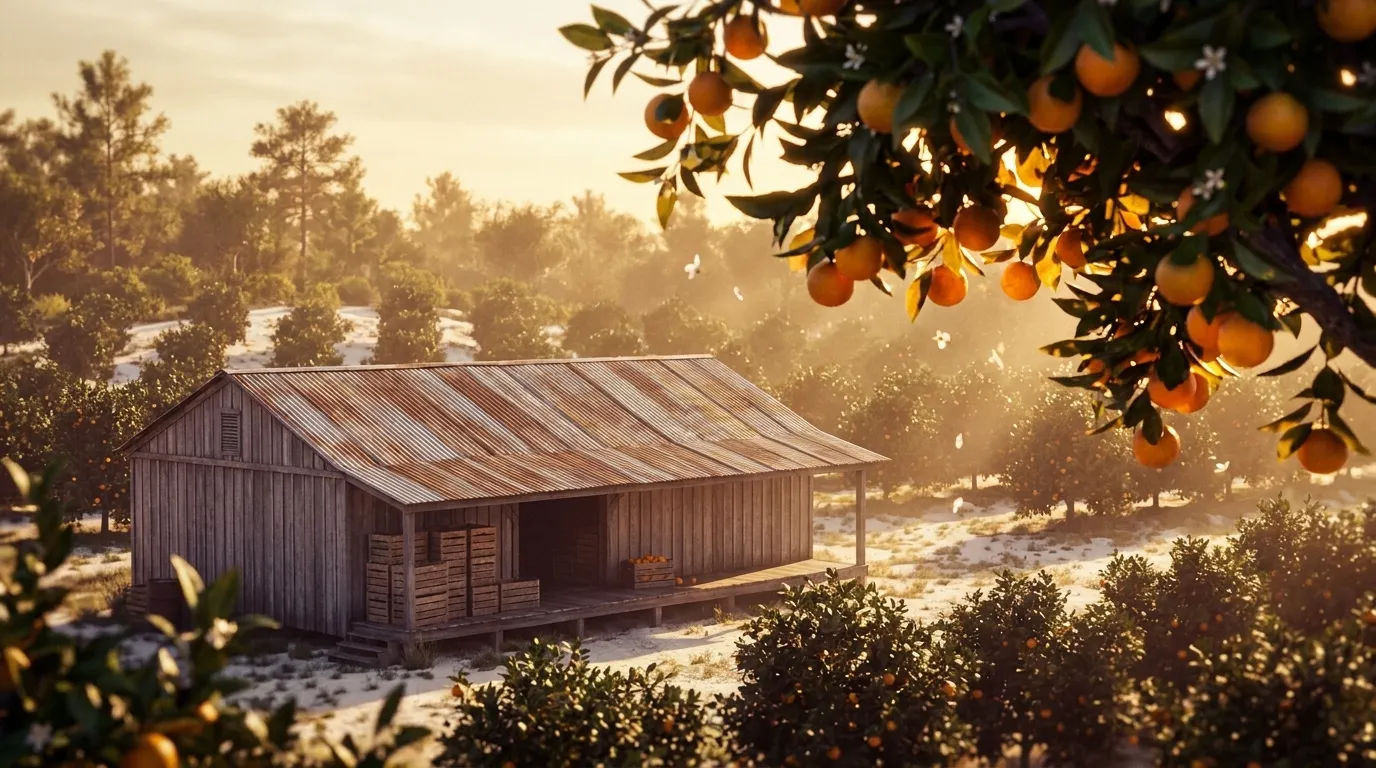
The Lake Wales Ridge, a well-drained white-sand spine running about 100 miles down the Florida peninsula from Lake County south through Orange, Osceola, Polk, and Highlands, anchors this historic citrus belt in USDA zones 9b–10a with 323-to-335-day frost-free seasons.
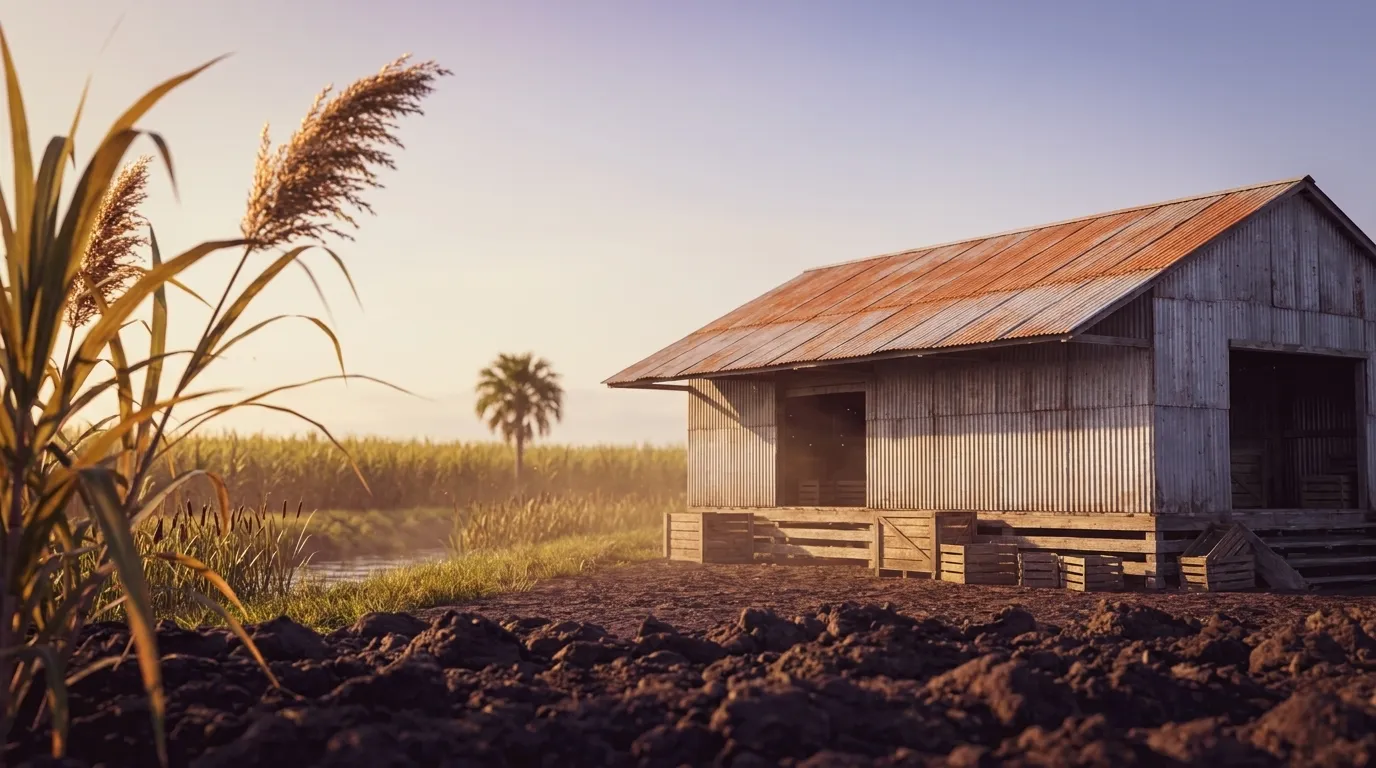
The Everglades Agricultural Area is roughly 700,000 acres of drained peat-and-muck farmland south of Lake Okeechobee, defined under Florida's Everglades Forever Act (§373.4592, F.S.); its member counties span USDA zones 10a to 10b with a frost-free to 326-plus-day growing season, the deep organic soils behind the region's sugarcane and winter-vegetable harvests.