Tab, Indiana, sits in USDA hardiness zone 6a — enough range to grow cool-season vegetables, hardy fruit, and warm-season crops that mature before the first hard frost.
Among the crops suited to this profile: cabbage, hazelnut, lavender, and collard greens. The site-level story — soil, sun, drainage — decides the rest.
Even in Tab, no two yards are alike.
A low spot, a south-facing slope, or a stand of trees moves the frost date and sun across a single Tab lot. Enter your address and we'll score 1,085 plants against your land's actual soil, sun, and frost.
We read public map data around Tab — soil, climate, flood, and parcel records. How we handle your address.
No card required · your parcel report in seconds — read in full free for your first 14 days
Tab — the short answer
Tab, Indiana: USDA zone 6a, about 200 days between hard freezes, across 150 acres of town.
- USDA zone
- 6a
- USDA PHZM 2023
- Last hard freeze (28°F)
- Apr 8
- NOAA 1991–2020 Climate Normals, 28°F — this town
- First hard freeze (28°F)
- Oct 25
- NOAA 1991–2020 Climate Normals, 28°F — this town
- Days between freezes
- ~200
- NOAA 1991–2020 Climate Normals, 28°F — this town
- Town area
- 150 acres
- US Census TIGER/Line 2025
Every figure names the dataset it came from. Hard-freeze dates are this town’s own 28°F normals: light frosts run a few weeks past them, and tender transplants usually wait 2–3 weeks after the last hard freeze.
Hardiness Zone Range
Zone 6a is Tab's average, not your lot's — a low corner or a tree line moves it. Against Tab's 200-day season, see what your own ground reads.
Soil varies lot by lot — soil types explained.
What this means for growing in Tab
Each reading below is measured for Tab itself — here is what it means for a garden here, and the move an experienced grower makes about it.
Season length
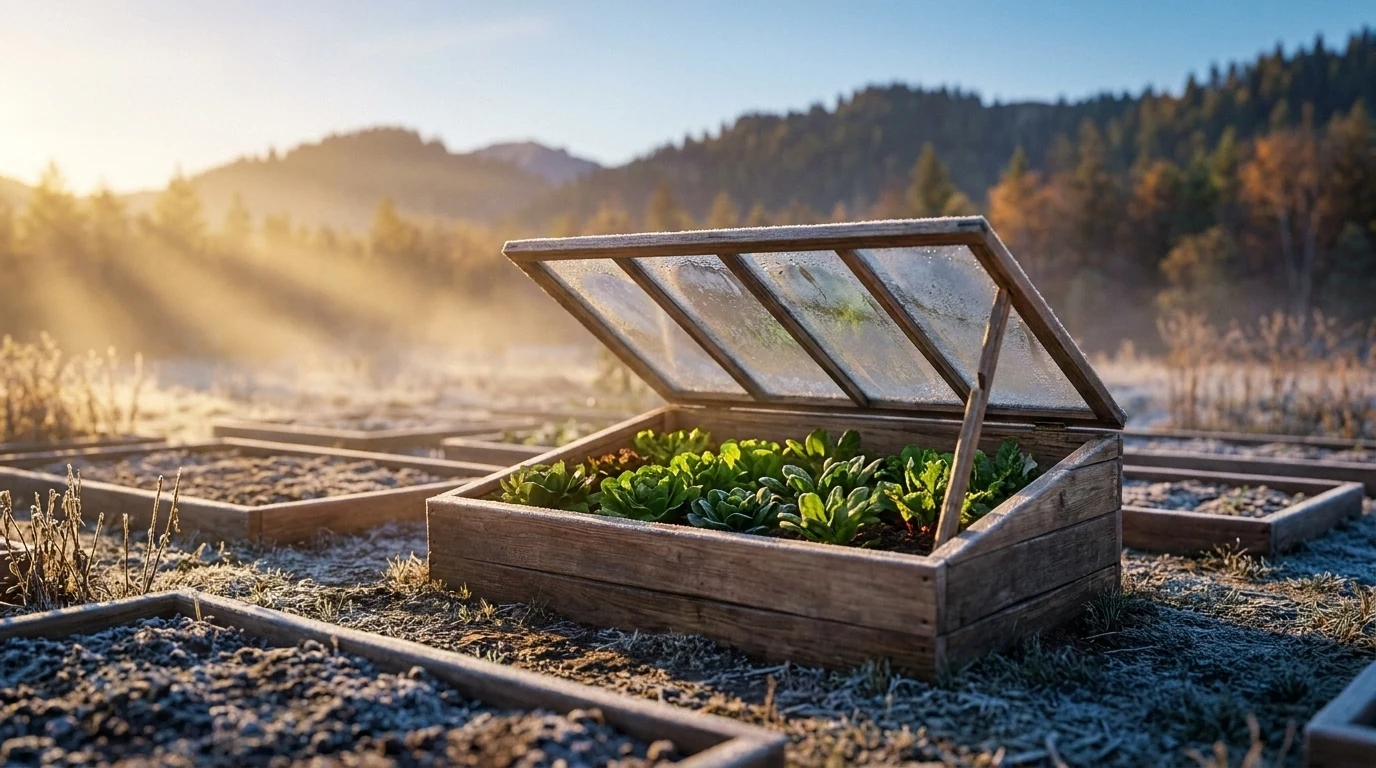
MeasuredTab runs about 200 days between hard freezes — a long growing season.
There is slack for succession plantings and slow-finishing crops: many vegetables can be sown twice, and the heat-lovers have time to ripen fully.
Plan a second sowing of quick crops after the first comes out, and use the fall window most gardeners let sit idle.
NOAA 1991–2020 Climate Normals
Winter hardiness
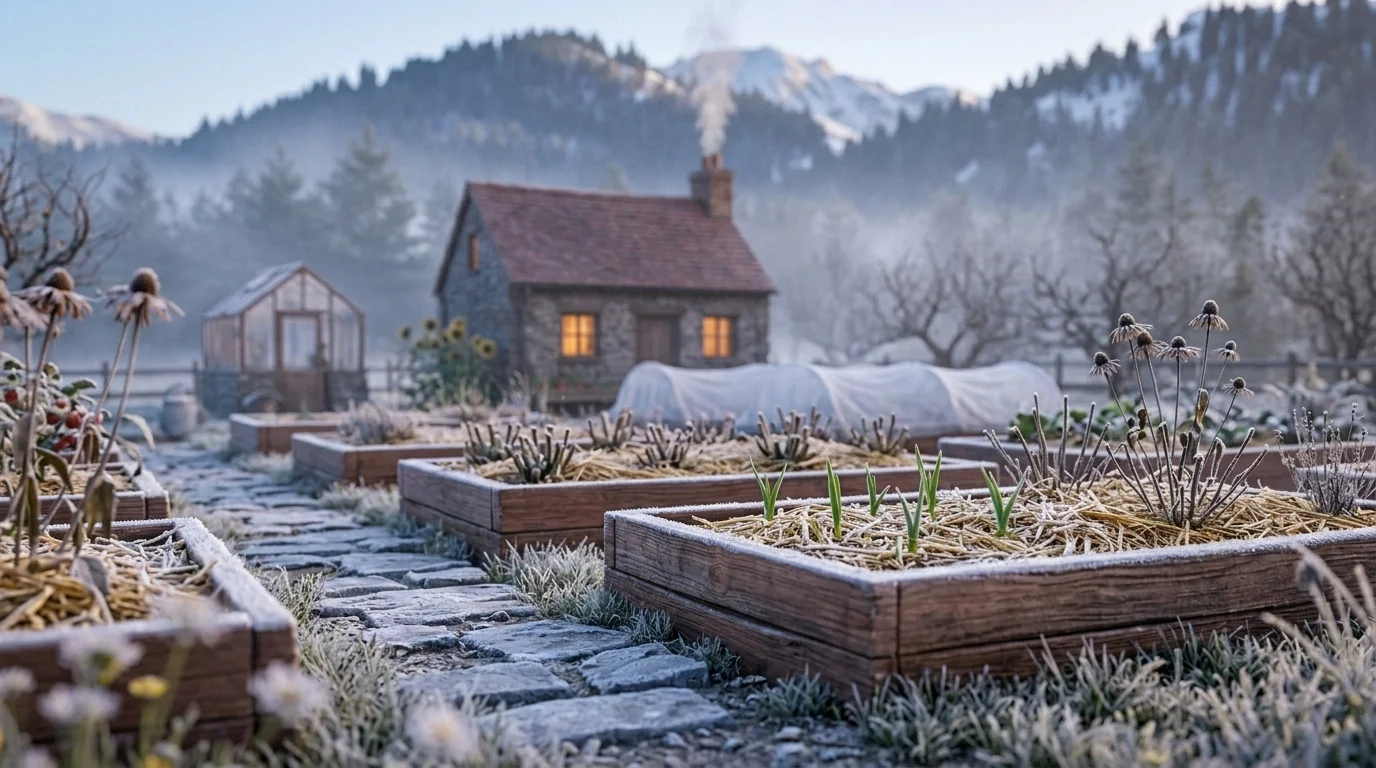
MeasuredTab sits in USDA hardiness zone 6a.
The zone sets which perennials, shrubs, and fruit trees live through an average winter here — a plant rated for a colder zone is a safe bet, one rated warmer needs winter protection or gets treated as an annual.
Match perennials and fruit to the zone before you buy, so nothing you plant is a gamble against the cold.
USDA PHZM 2023
The kind of country Tab is in
Tab sits in the Central Corn Belt Plains — EPA Level III, inside the wider Eastern Temperate Forests. That is read at Tab's own centroid rather than borrowed from Warren County.
What Grows in Tab
Every plant below cleared Tab's own zone 6a and its 200-day season. Each card opens that plant's Indiana profile. How we score.
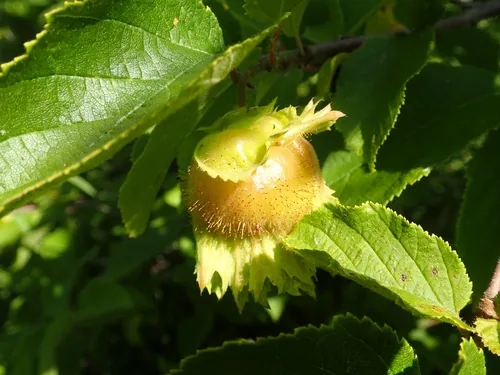
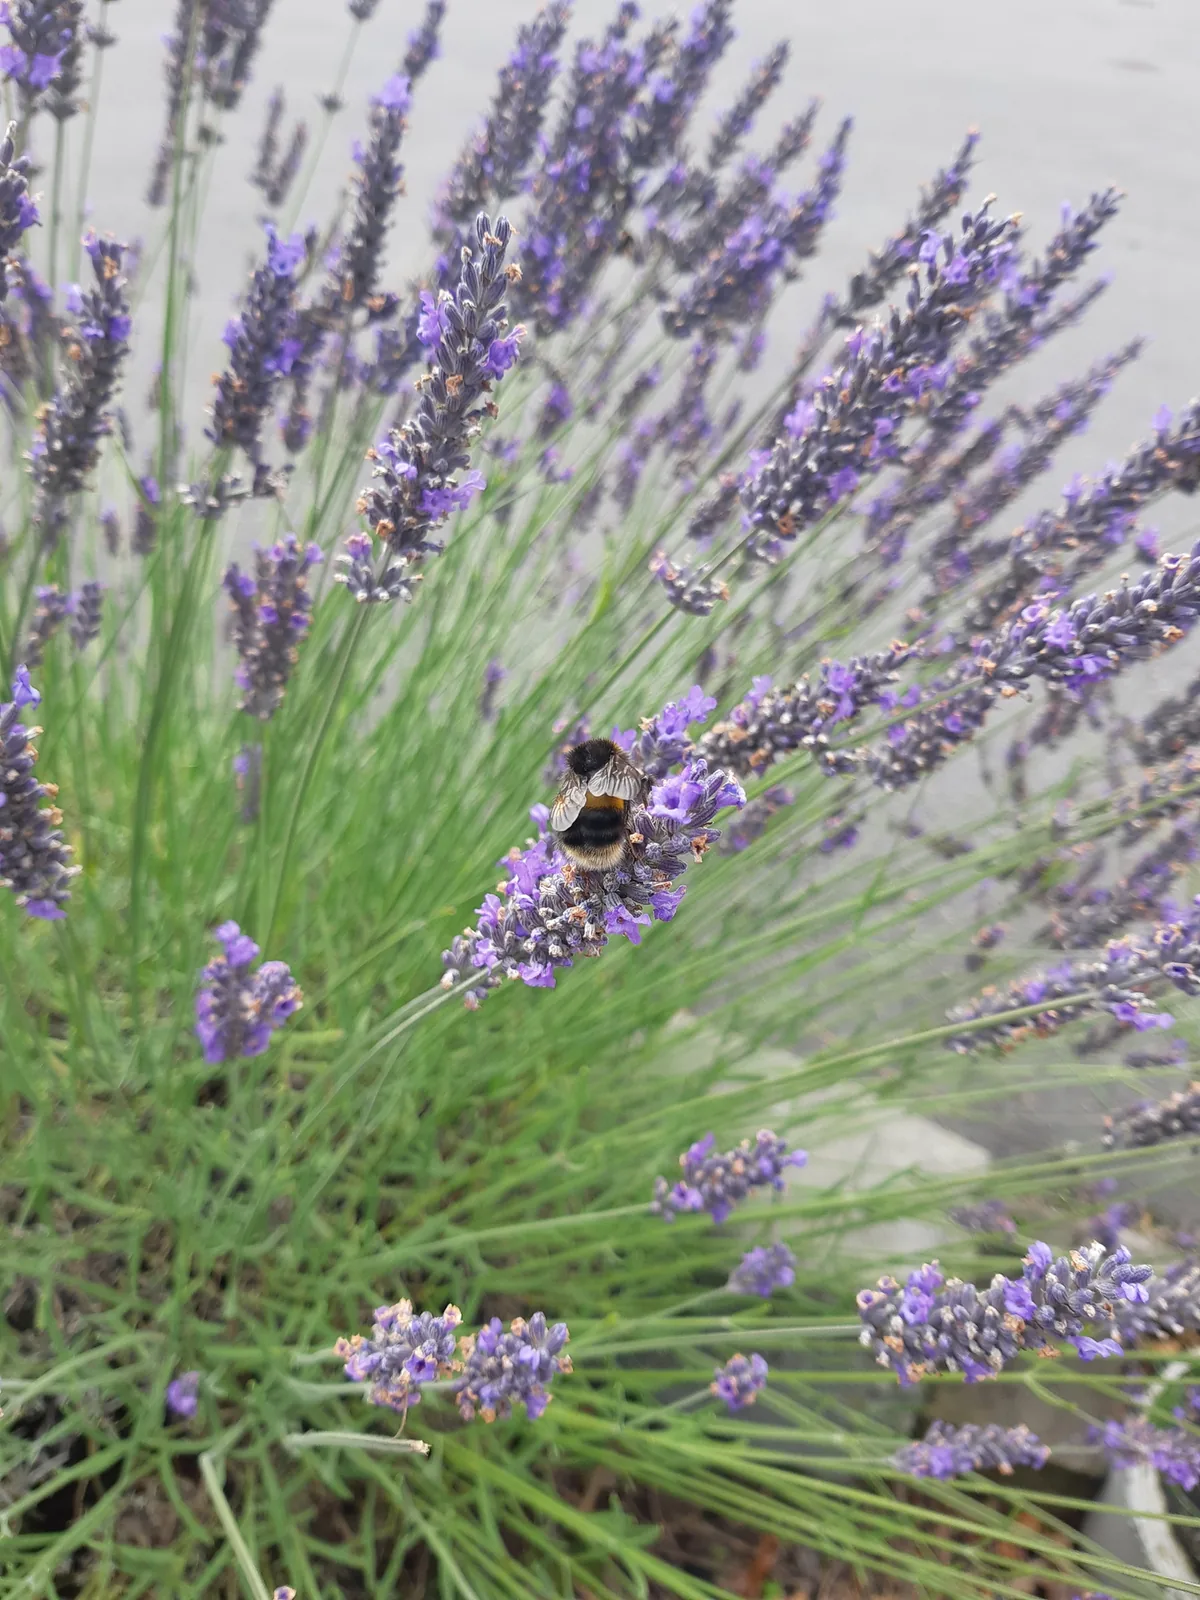
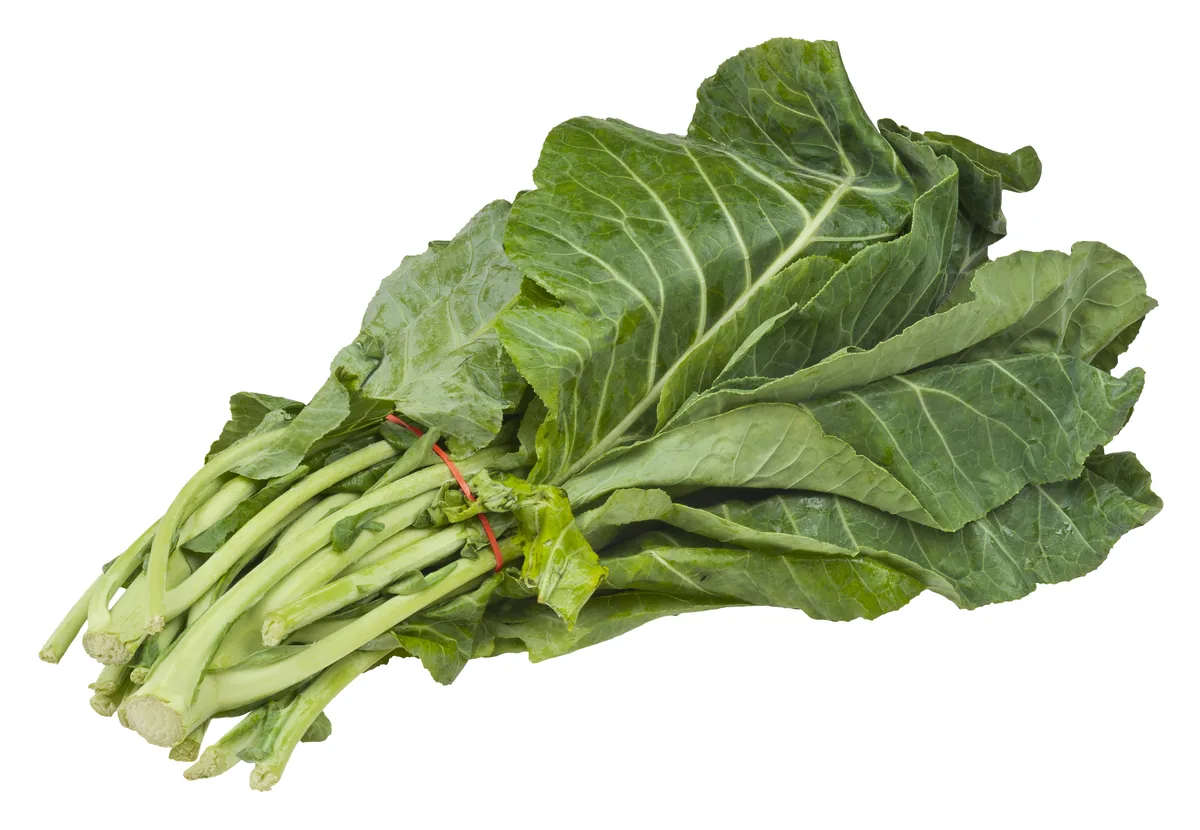
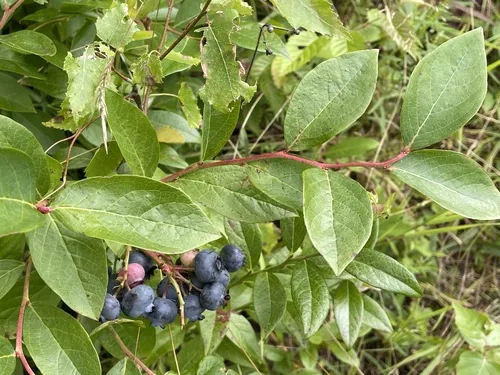
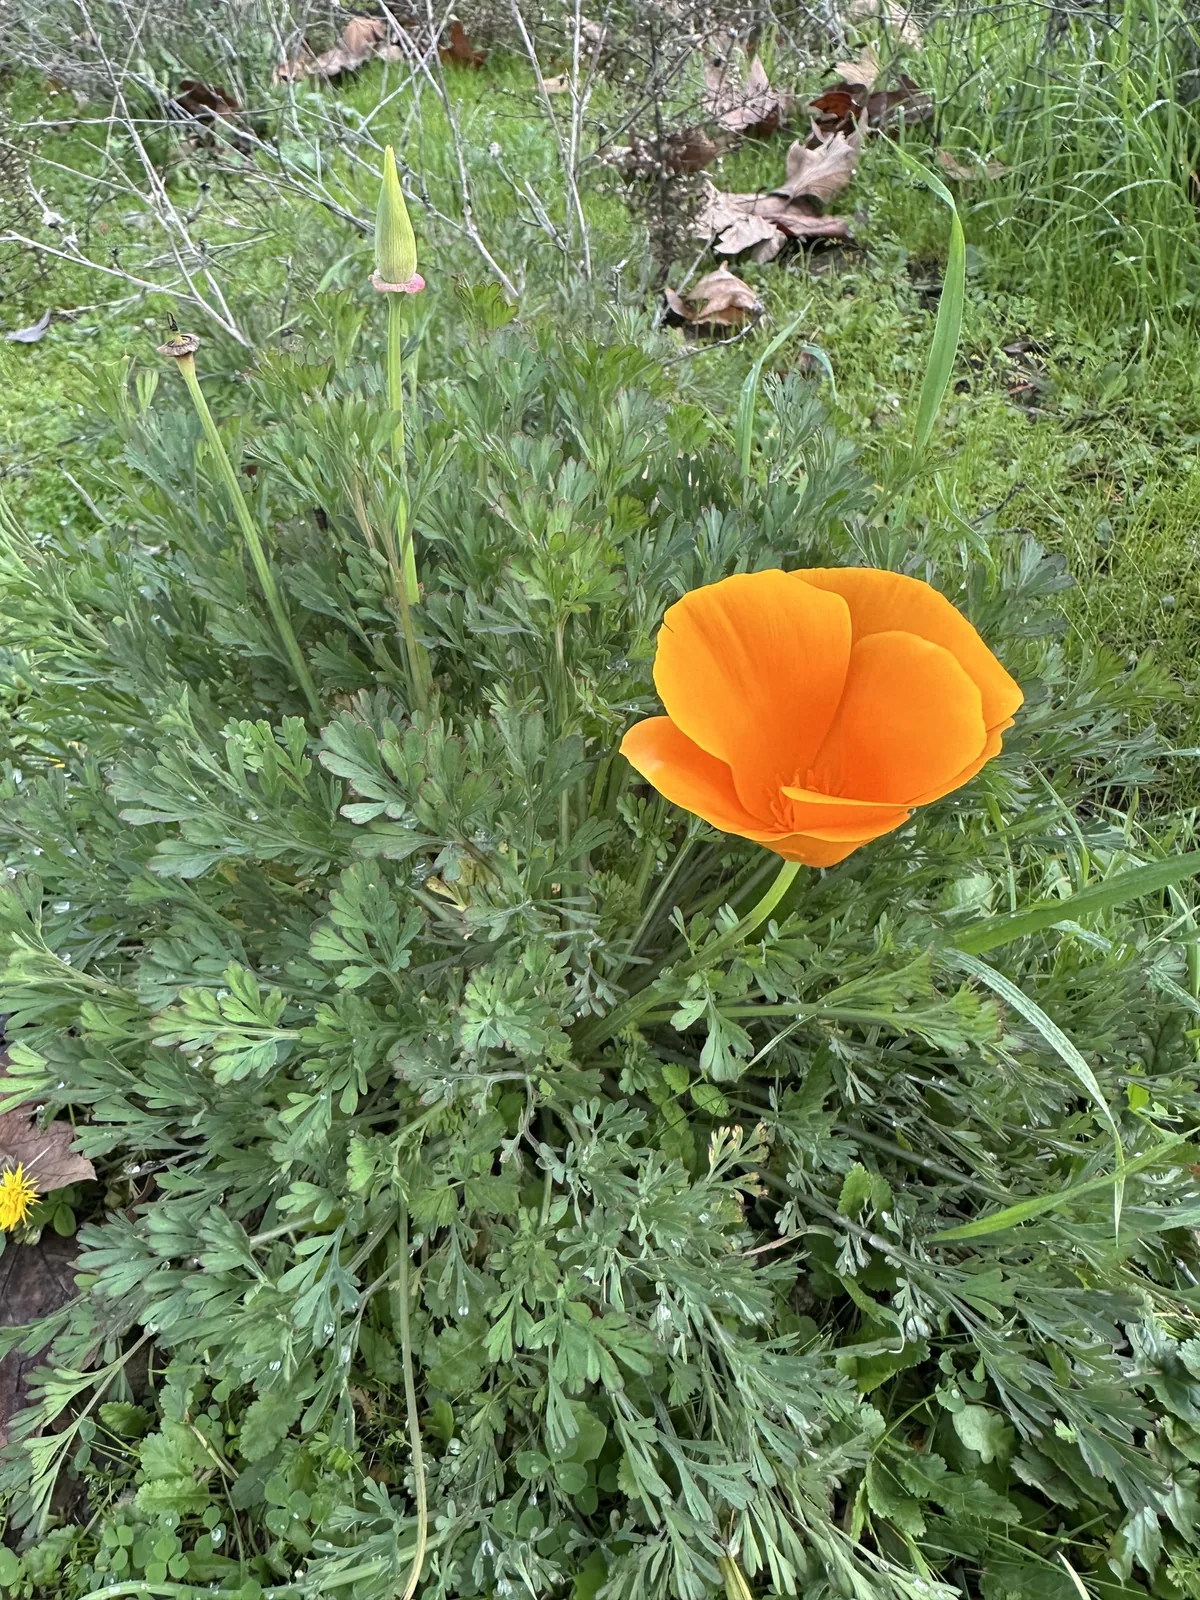
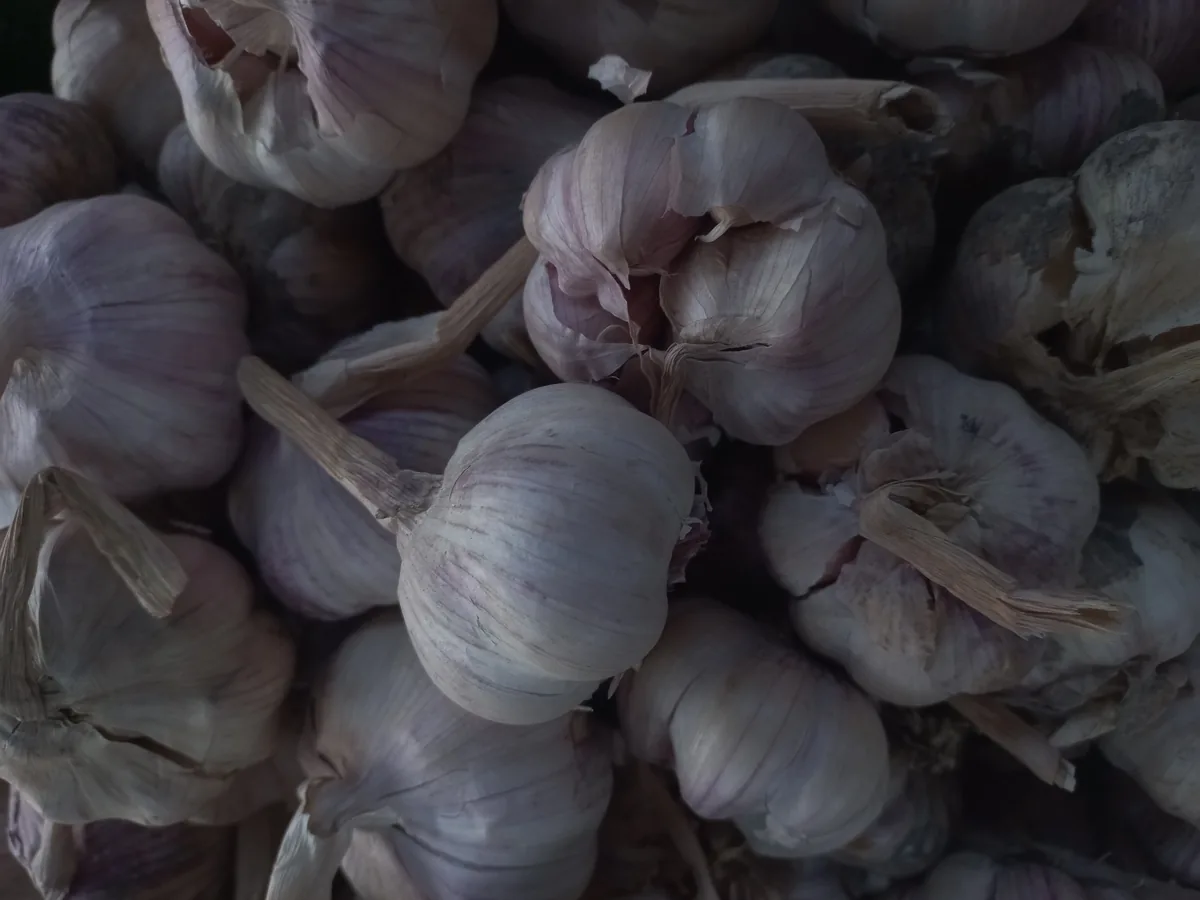
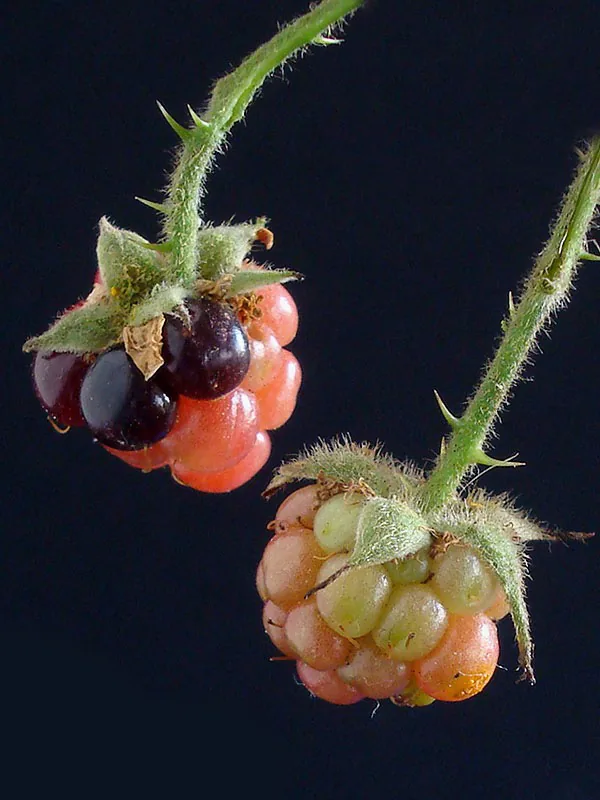
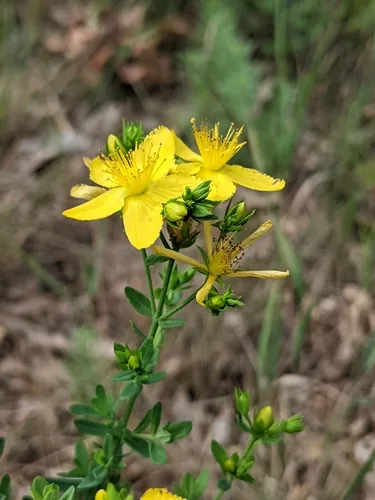
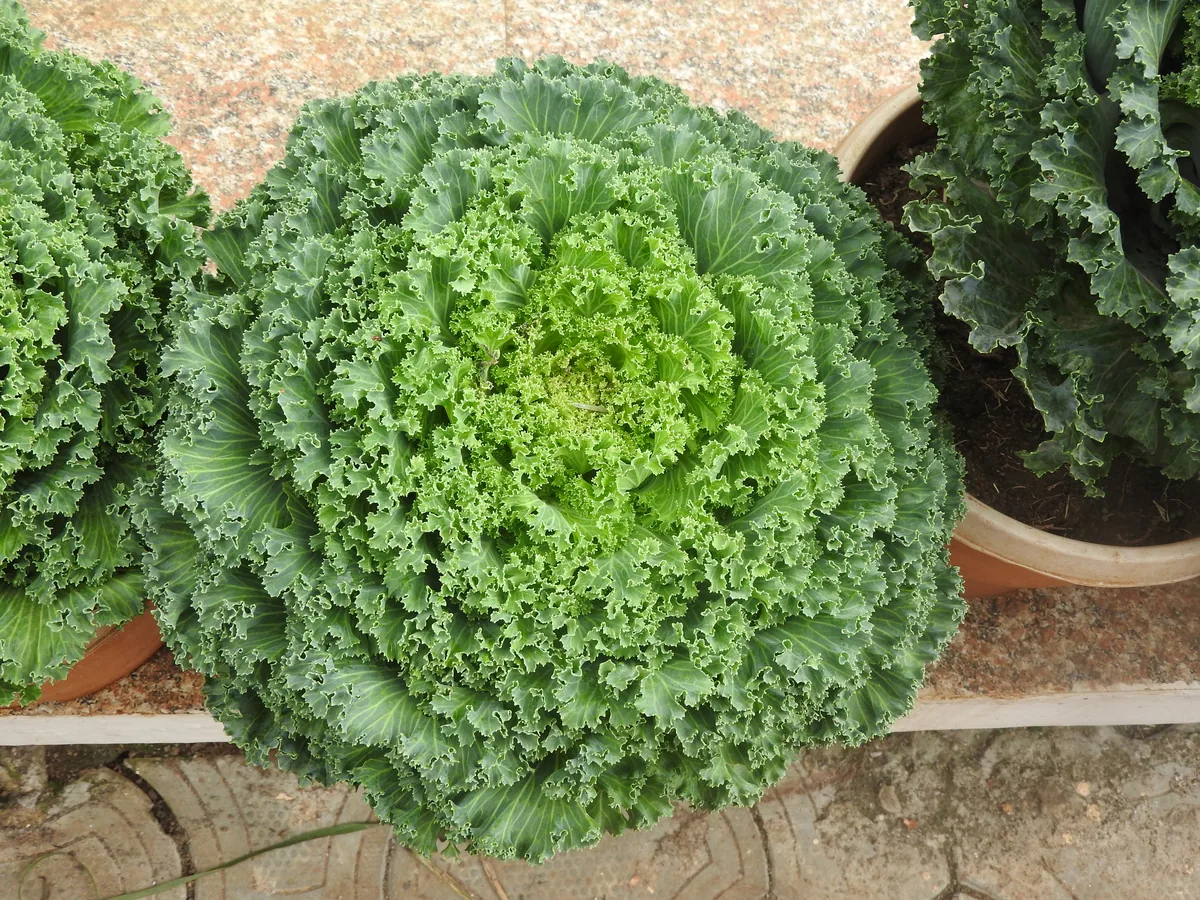
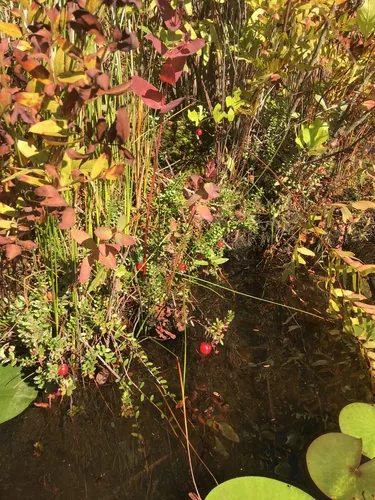
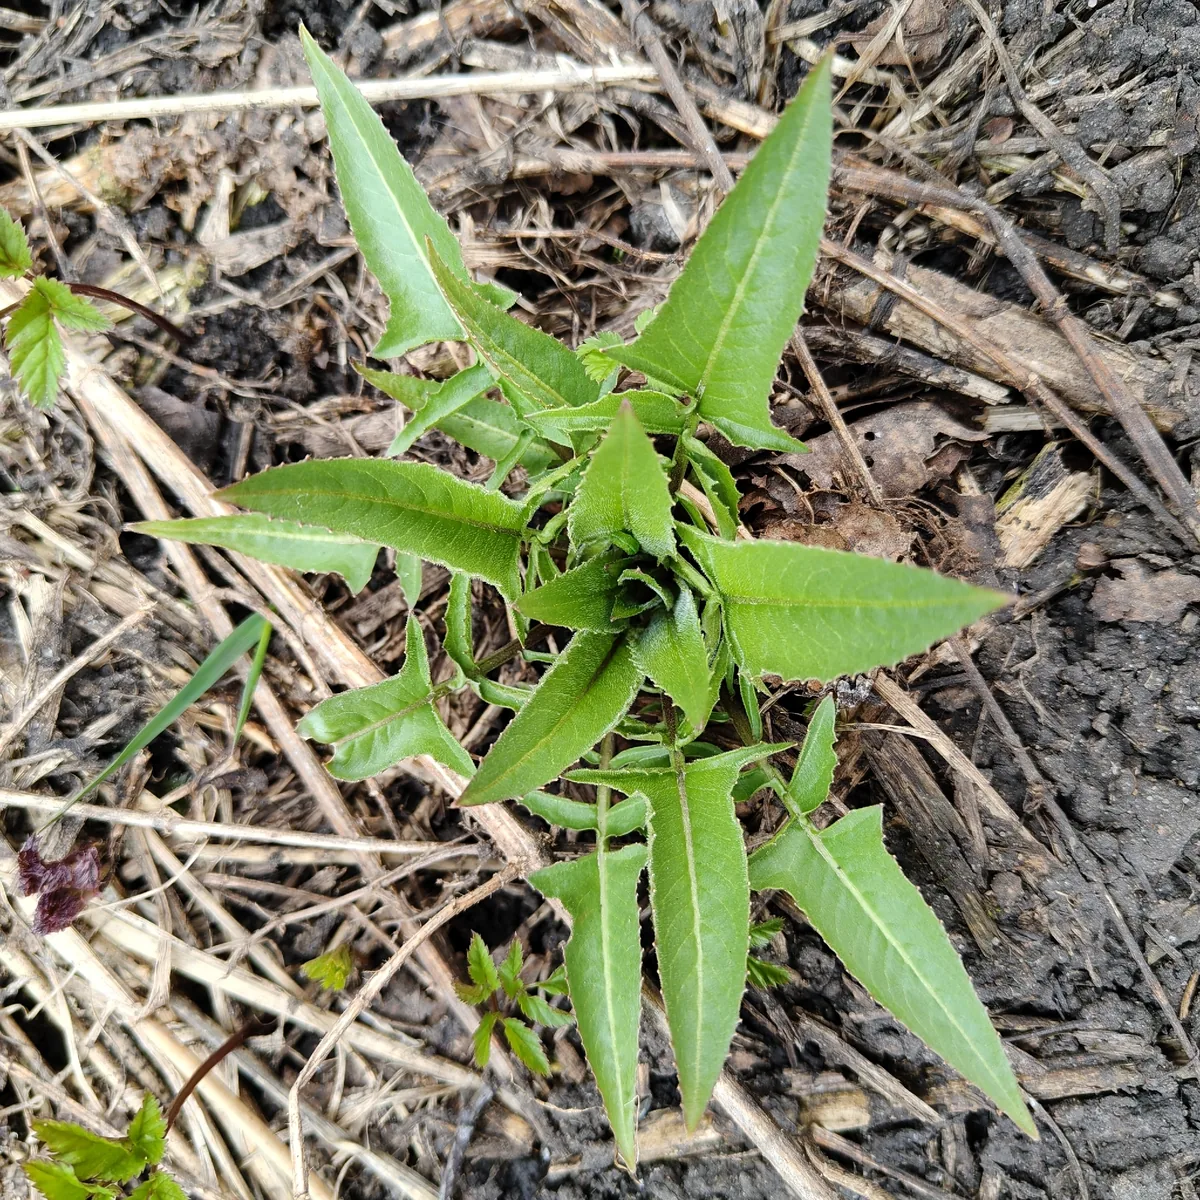
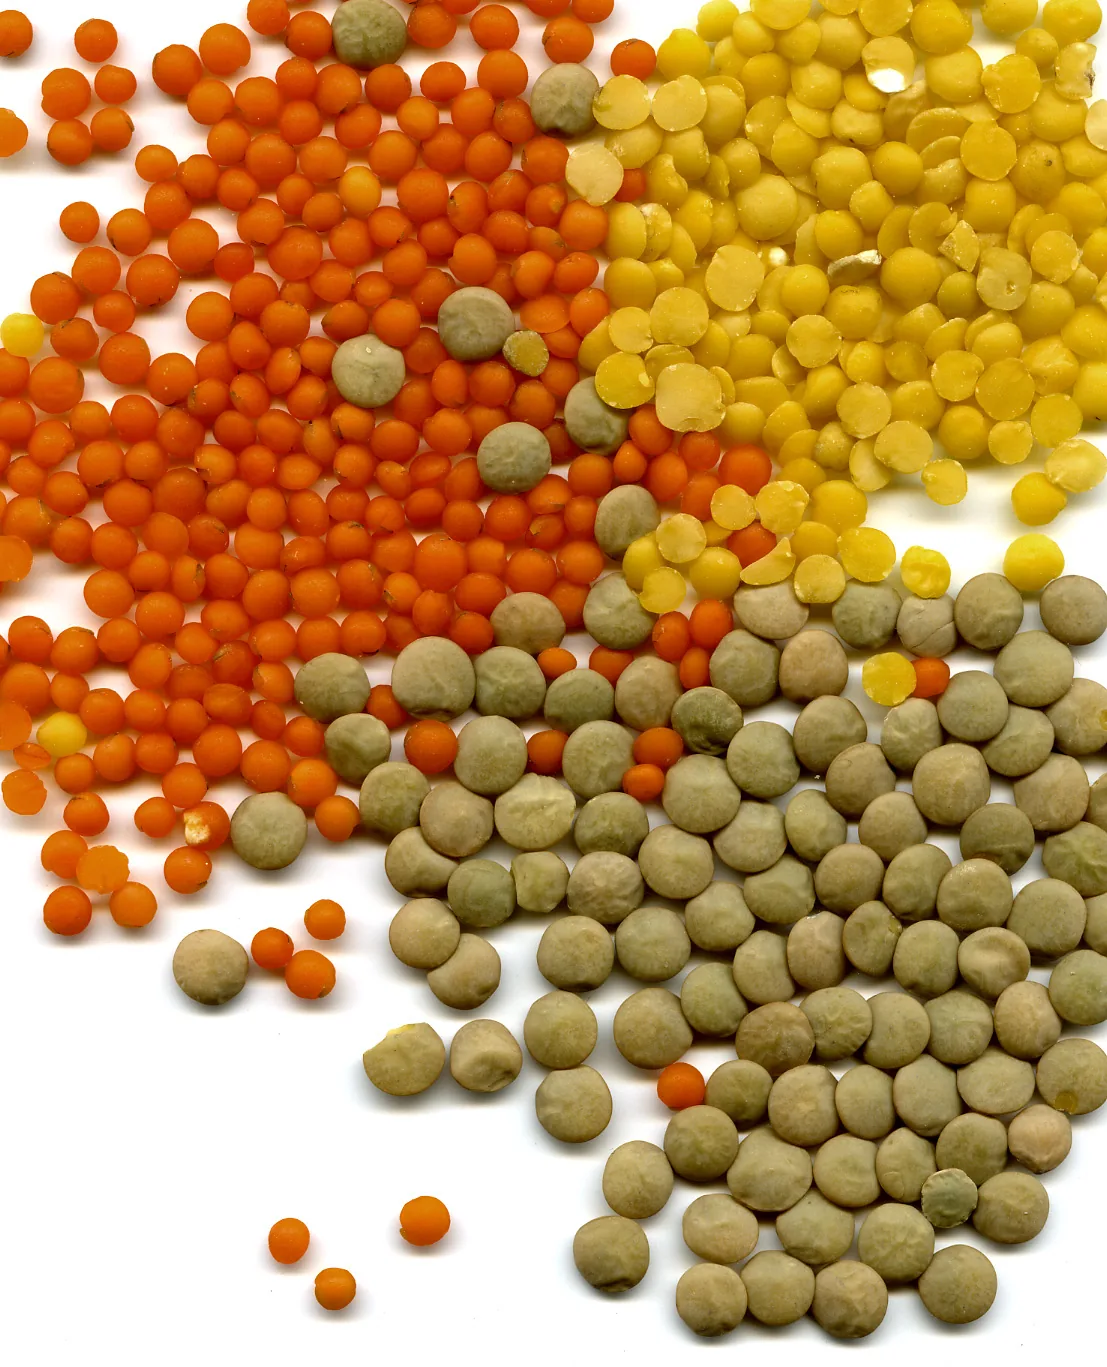
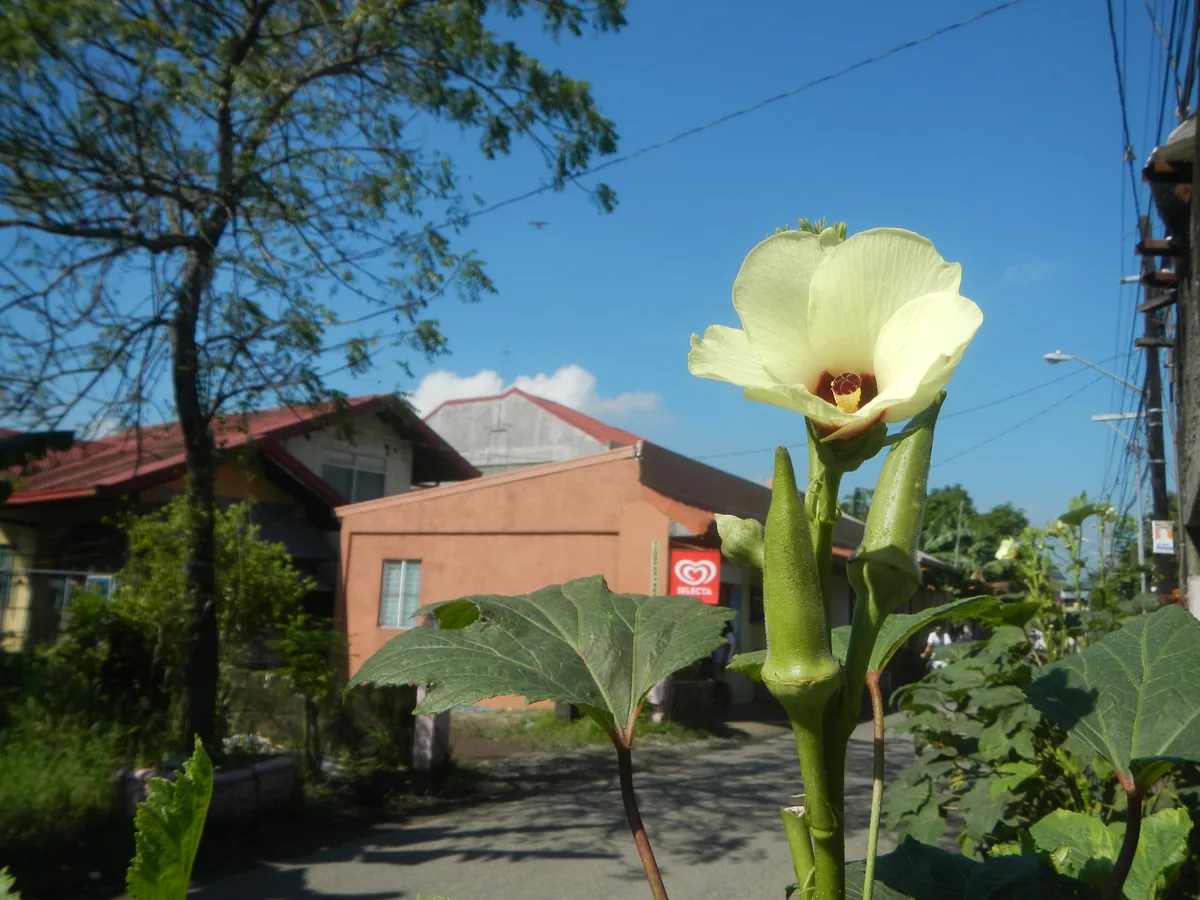
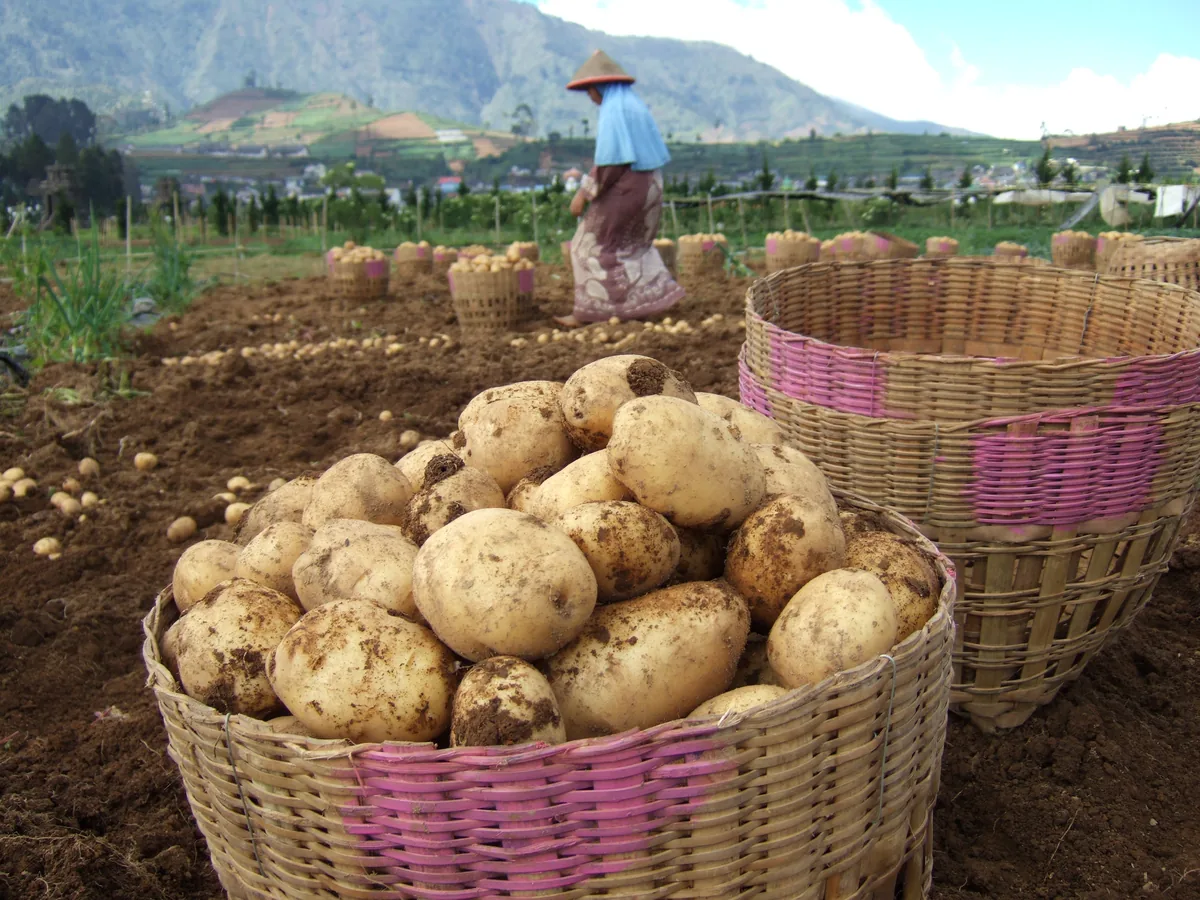
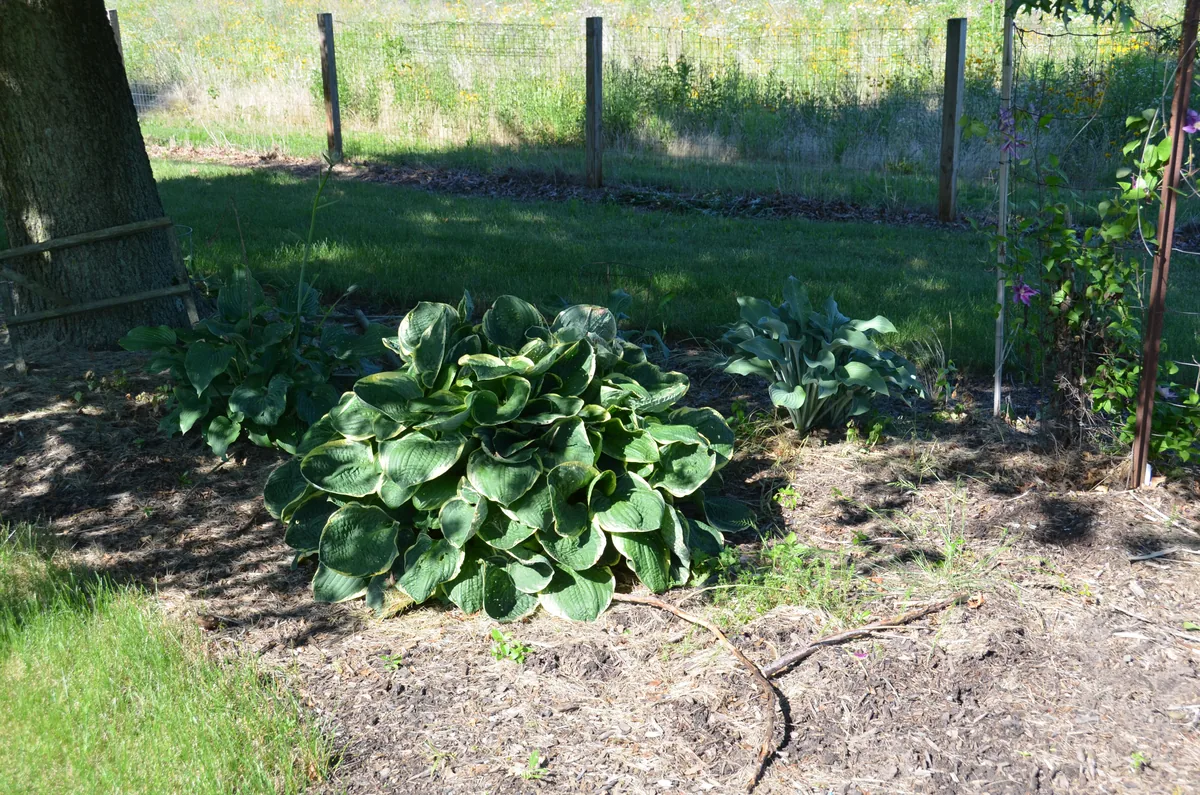
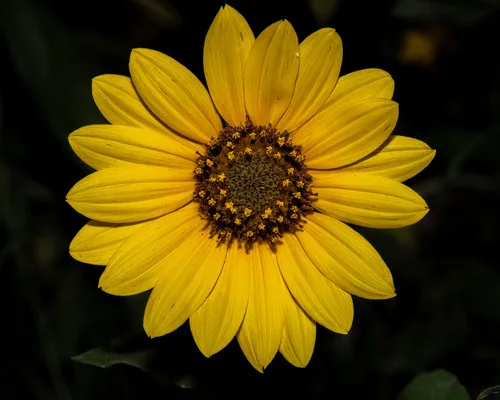
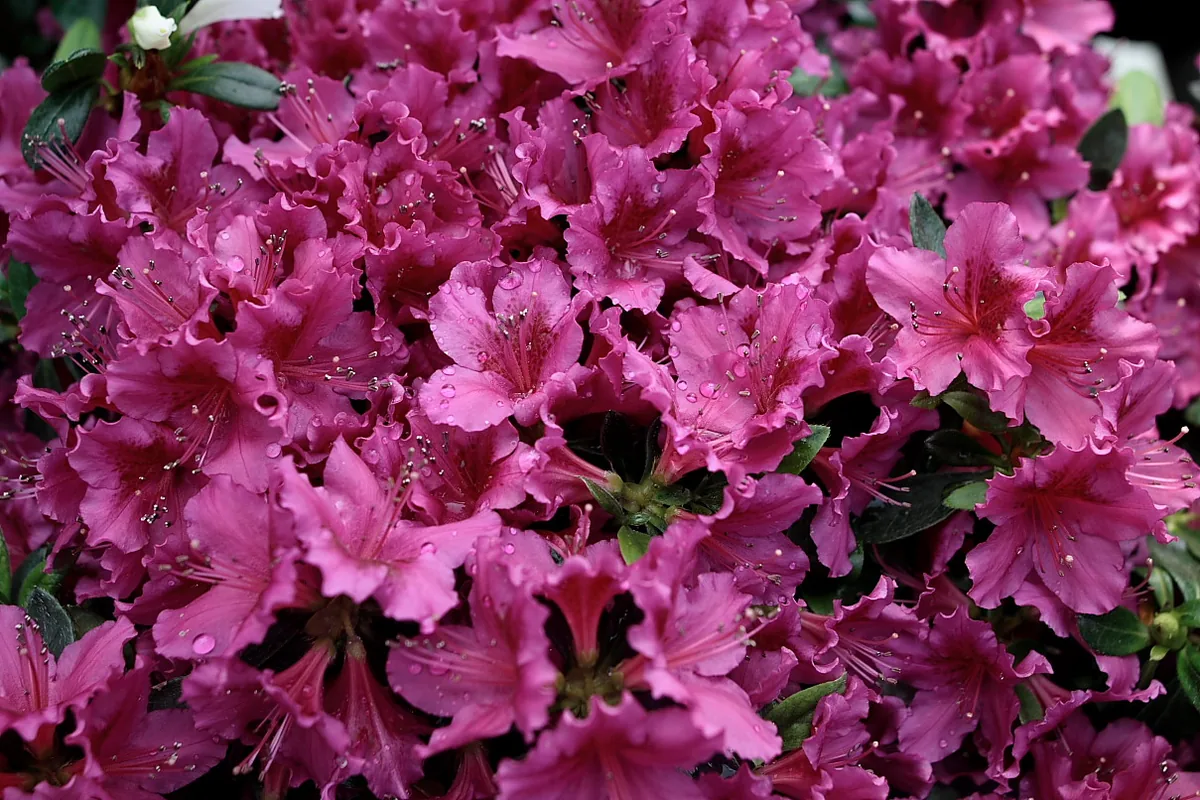
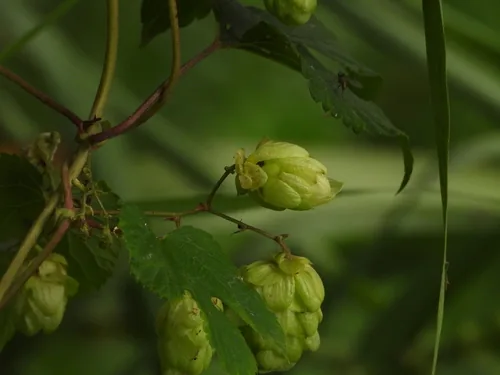
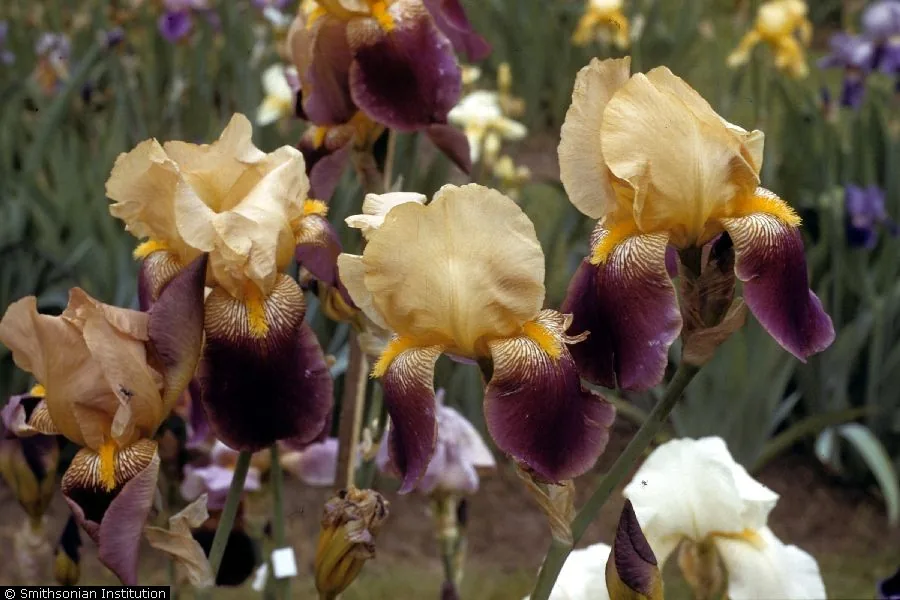
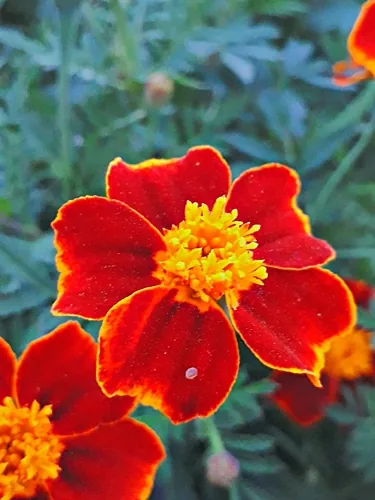
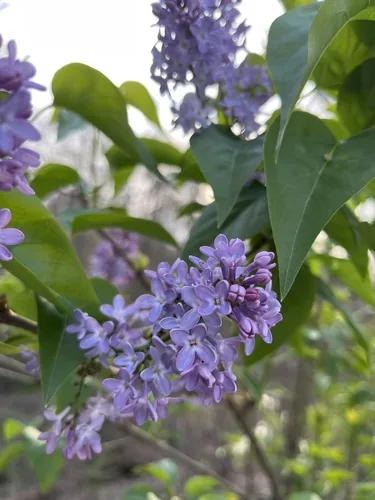
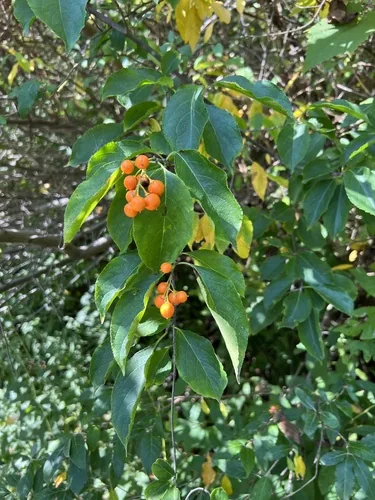
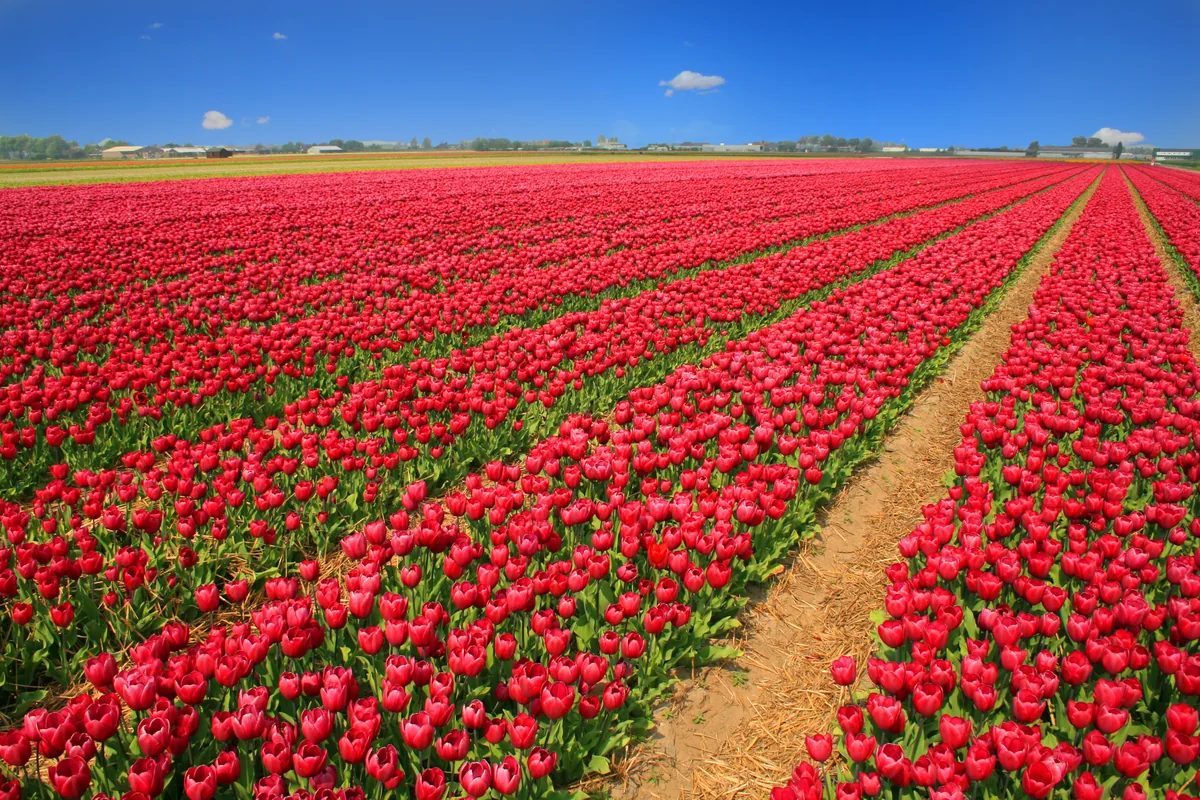
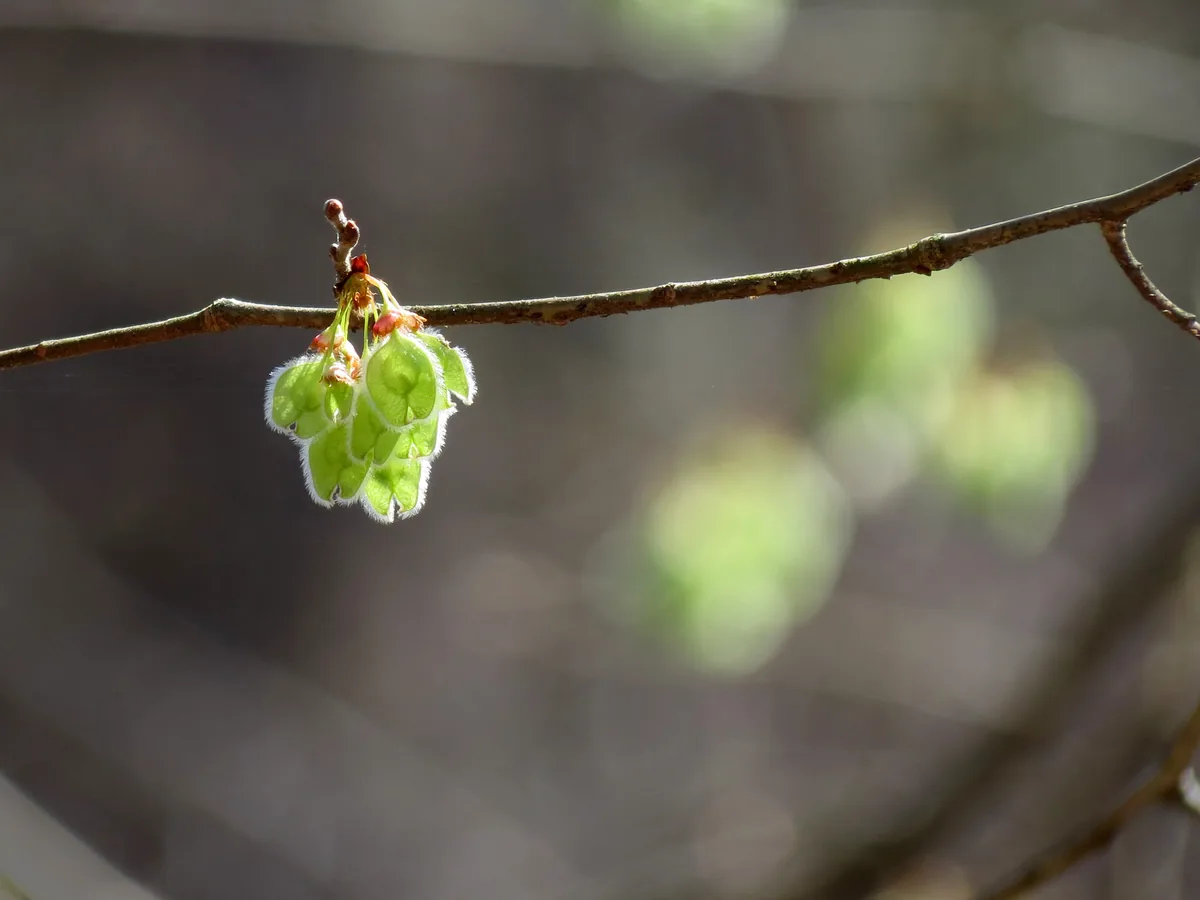
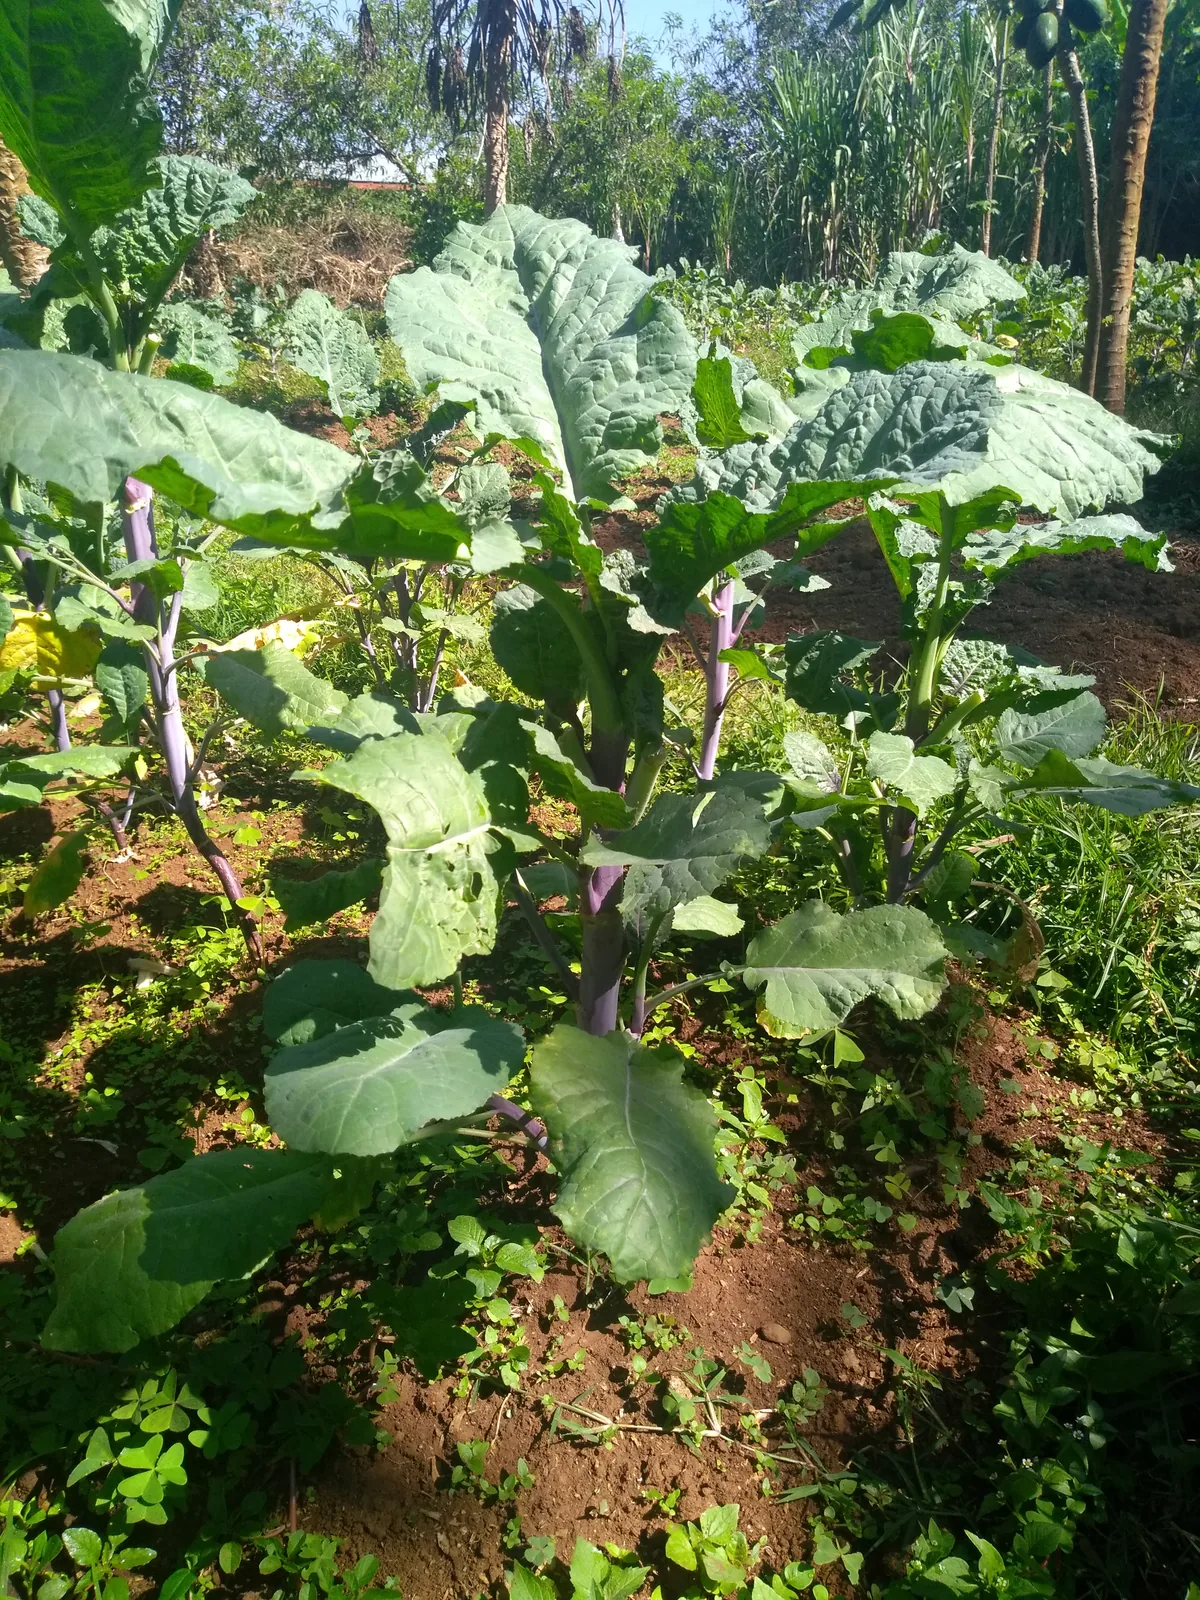
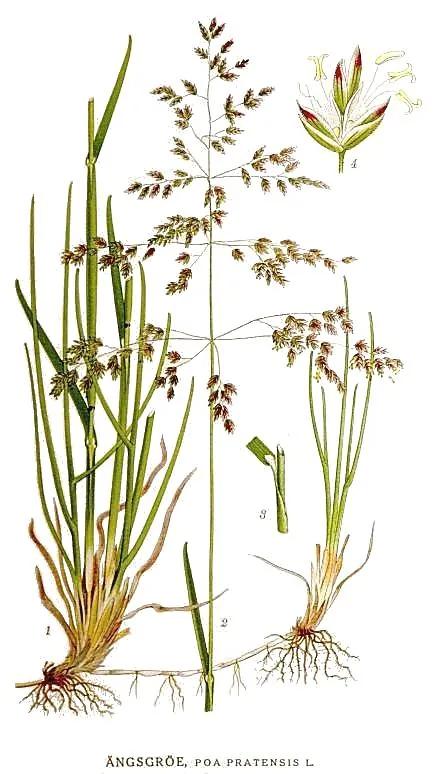
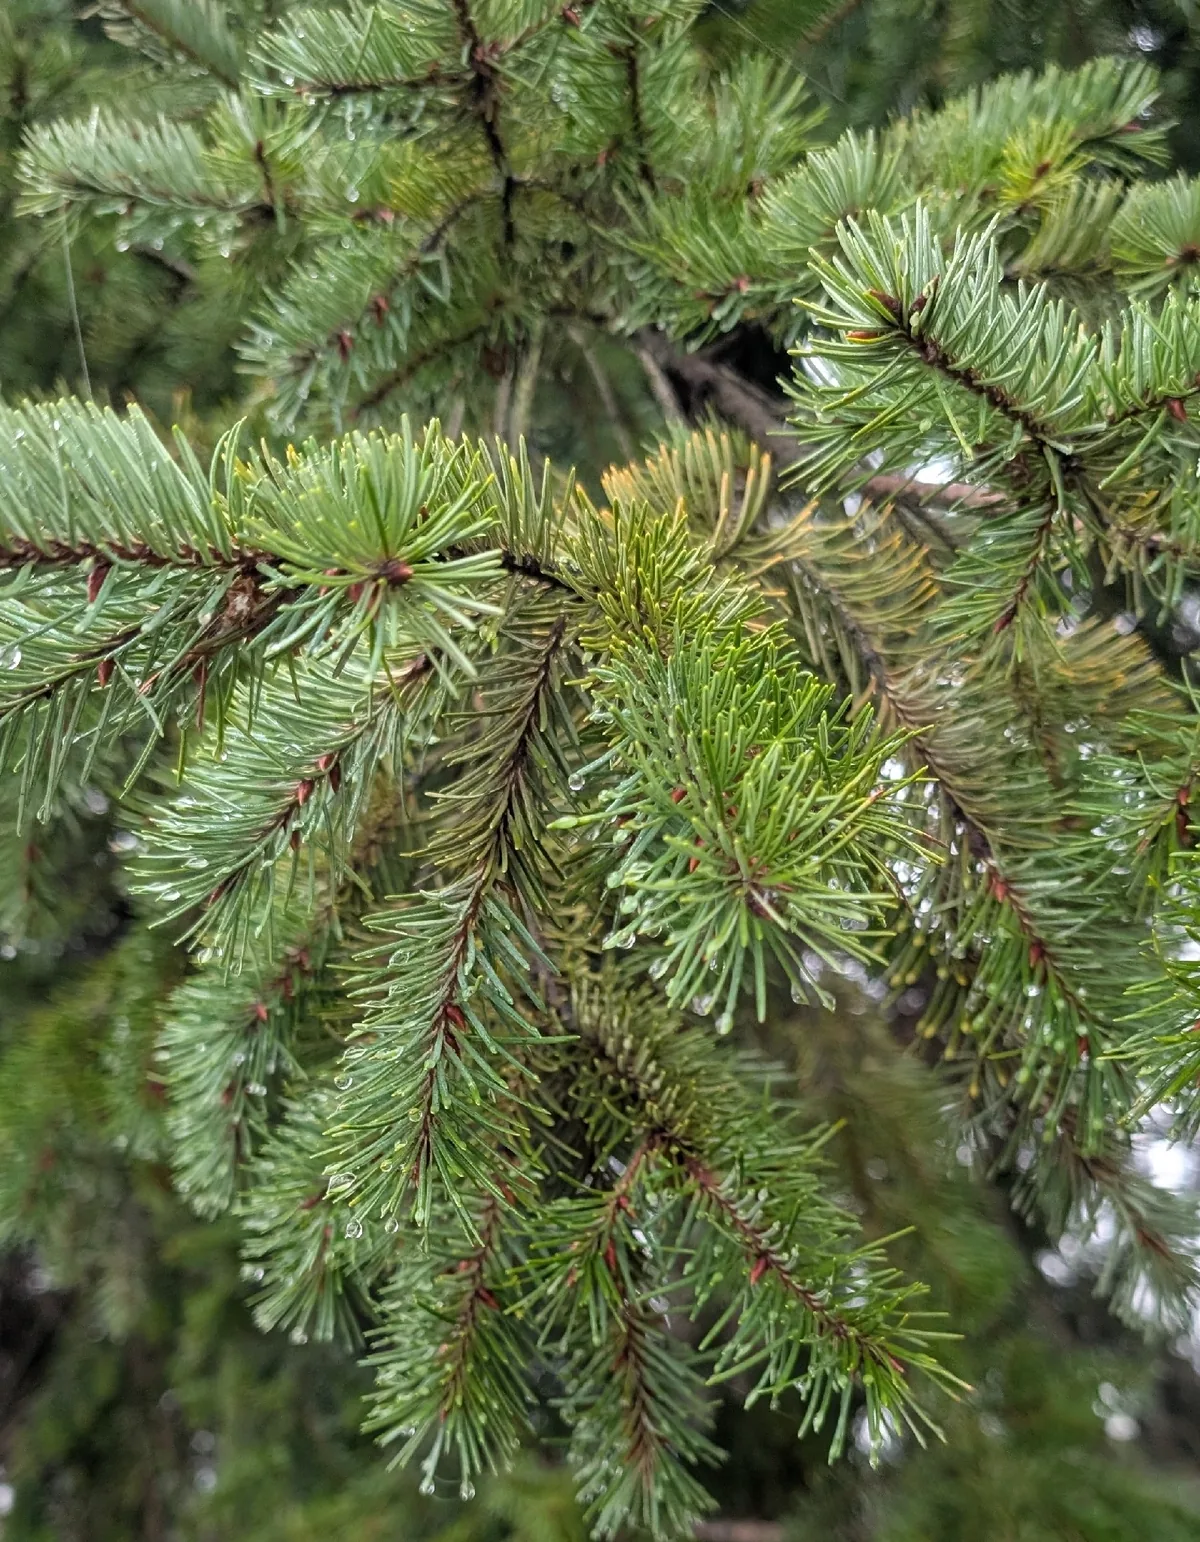
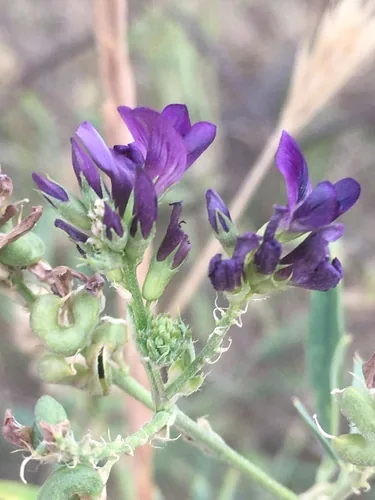
More to grow in Indiana
Indiana has a growing page for many more plants than fit above — a rotating sample of the rest of the shelf.
Is it too late to plant in Tab?
Too late for some crops, right on time for others — a growing season is a sequence, not a deadline. Cool-season crops can go in from around Mar 11; tender transplants wait until two to three weeks after the last 28°F hard freeze, which lands near Apr 8 (NOAA 1991–2020 climate normals); and from midsummer, planting counts back from the first fall freeze around Oct 25 — long-season crops need about 90 days of runway, quick greens only 30. There is slack in a calendar like this — late plantings, second rounds of favorites, and a fall bench that keeps beds working.
Documented around Tab
Survey cells within 31 miles of Tab checked for spotted lanternfly, none carrying a detection — a surveyed negative, not an absence of looking. Nearest documented record 63 miles off. What to watch for.
What's on the federal record near Tab
Closest first, within ~10 miles of Tab. Listing isn't leaking, and distance isn't exposure.
- TERRA INTERNATIONAL INCBrownfields · 3.8 mi
- TERRA INTERNATIONAL, INC. - WILLIAMSPORT, INBrownfields · 3.8 mi
- JORDAN CREEK WIND ENERGY CENTERBrownfields · 4.8 mi
- Alltel IllinoisincUnderground Storage Tanks · 6.7 mi
- Car ShopUnderground Storage Tanks · 6.7 mi
- NUTRIEN AG SOLUTIONSBrownfields · 6.8 mi
- POLAND DAIRY FARMCAFO · 7.4 mi
- Calcium Products Incorporated Div Irving Materials IncorporatedUnderground Storage Tanks · 7.5 mi
- Trunkline Gas CompanyUnderground Storage Tanks · 7.6 mi
- TRUNKLINE GAS COMPRESSOR STATIONBrownfields · 7.6 mi
- INDOT CARBONDALE UNITBrownfields · 8.0 mi
- Chisms CornerUnderground Storage Tanks · 8.3 mi
6 more sites are on the record inside the same radius.
Measured from Tab's center, not your beds. Run your own address for what's upwind of you specifically.
Browse the full contamination data for this area
Environmental Intelligence
The counts behind that headline — every source type on the record near Tab.
Total Sites
23
within ~10 miles of Tab
Risk Level
Low
Highest-severity
1 concentrated animal feeding operation
Sources Checked
within ~10 miles of Tab
Severity Distribution
within ~10 miles of Tab
Highest-Severity Sites
 Know Before You Grow
- •Underground tanks leak petroleum as they age — near a former filling station, test the soil.
- •Near a brownfield, raised beds of imported soil give your food clean ground.
- •Large animal operations push nitrates and bacteria downstream. Below one, test your water.
Check your specific parcel in Tab
Get exact proximity distances to contamination sources for your specific parcel — plus soil, sun, drainage, and 1,085 plant recommendations.
25+ data sources read at your address, not the Tab average
Your land is one point inside Tab
Everything above resolves to Tab as a whole — one PHZM band and one 28°F frost record, read across 150 acres. Your parcel is one point inside that footprint. Slope, tree cover, a low spot that pools cold air, and what is in the soil are all resolved at the address, and none of them are visible at town scale. That is the honest boundary of this page, and the reason the next step is a reading of your own ground rather than a better local average.
Your Lot vs the Tab Average
Tab Average
- ●USDA Zones 6a, averaged across Tab
- ●One soil character for all of Tab
- ●Frost dates read at Tab's scale: Apr 8 to Oct 25
YOUR Parcel
- ✓Your exact zone, not Tab's 6a
- ✓Your SSURGO soil type & pH
- ✓Your sun exposure, cast in 3D
See MY Growing Report
Read your specific parcel in Tab
Pull a site-specific report for your exact address in Tab, Indiana — soil, sun, drainage, frost risk, and scored plant recommendations.
Three things about your lot that Tab averages can't show:
We read public map data around Tab — soil, climate, flood, and parcel records. How we handle your address.
25+ data sources read at your address, not the Tab average
How we know this about Tab
The datasets: hardiness from the USDA ARS Plant Hardiness Zone Map 2023, read at this town’s own centroid; hard-freeze dates from NOAA 1991–2020 28°F normals at Tab’s own record; boundaries and acreage from US Census TIGER/Line 2025; the contamination records from the federal sources named in their beats above. Soil is not read at town grain anywhere on this page — there is no town-resolution survey in our data, which is why you will find no soil grid here rather than a statewide one wearing a local label. The resolution ledger below names every figure this page inherited.
Common questions about Tab
When does frost risk typically end in Tab?
The last hard freeze (28°F) in Tab typically lands around Apr 8, per NOAA 1991–2020 climate normals — earlier than the light-frost dates most charts quote. That marks the hard freeze, not the last light frost — lighter frosts keep biting past it, which is why tender transplants here wait until about Apr 29.
When is the first frost in Tab?
The first hard freeze (28°F) in Tab typically arrives around Oct 25, per NOAA 1991–2020 climate normals — the point tender summer crops finish. Lighter frosts run ahead of it, near Oct 11, so the watching starts about Sep 25 — about 200 days after the spring freeze cleared.
How long is the growing season in Tab?
Measured between 28°F hard freezes, Tab sees about 200 frost-free days — roughly Apr 8 through Oct 25, per NOAA 1991–2020 climate normals. Tender crops work a shorter one: nearer Apr 29 to Oct 11, about 165 days.
Is the soil safe to grow vegetables in Tab?
The federal record around Tab is light — 23 documented sites across the 8 federal source types we checked, mostly Underground Storage Tanks entries (15), the nearest Brownfields record about 3.8 miles out — and proximity to a documented site is information, not a diagnosis of any one yard. Growing food here starts from a strong position; a soil test before new food beds settles any site-specific question.
How do I protect my plants from frost in Tab?
From about Sep 25 the job here turns from planting to protecting — the last start even a 30-day crop can finish. As the season closes around the first 28°F hard freeze near Oct 25 (NOAA 1991–2020 climate normals), three moves buy time: row cover or an old sheet over tender plants on still, clear nights; water the soil the afternoon before a freeze, so it holds warmth overnight; and harvest tomatoes, peppers and basil before Oct 25. Hardy greens and roots shrug off light frost and sweeten after it — leave them in.
Everything above is measured at Tab's scale — its 6a band and its 200-day season. Your yard writes its own version of Tab's numbers: we read soil, sun, drainage and frost at your exact address. Try it for 14 days — no card required.
What this page reads at Tab’s own scale
7 of the readings below were taken at Tab's own scale — its own ~200-day season between 28°F freezes, the 150 acres it covers and 23 documented sites around it; 4 are borrowed from a wider read, named and linked below.
Measured here
- Tab's own USDA hardiness band, zones 6aUSDA PHZM 2023
- Tab's own 28°F hard-freeze dates, about Apr 8 and Oct 25 and the ~200-day span between themNOAA 1991–2020 Climate Normals
- 23 documented contamination sites on the federal record near Tab, the closest Brownfields record about 3.8 miles out from the town centreFederal environmental registers
- Tab's boundary and the 150 acres inside itUS Census TIGER/Line 2025
- Which of 1,085 plants clear zones 6a and a ~200-day seasonGrowable Ground crop-matching engine
- The ecoregion at Tab's own centroid, the Central Corn Belt PlainsUS EPA Level III Ecoregions
- Lanternfly survey cells around Tab checked, none carrying a detectionlydemapr (De Bona & Helmus), 10 km survey lattice
Inherited from a wider read
- Soil character — no town-scale survey exists, so Tab's 150 acres read through its county's SSURGO summaryfrom Warren County
- Growing-degree days and winter chill — measured county-wide only, so the county page carries themfrom Warren County
- The growing challenges every Indiana grower plans around — written at state scale, so they stay on the state guidefrom Indiana
- Butterfly and beetle records, and the farmland pesticide estimate — all published county-widefrom Warren County
What this page can’t tell you
- The soil pH, drainage, sun hours, and frost pockets on any one lot among Tab's 150 acreswhy one lot differs from the next →
- Which side of Tab you're on — a low spot frosts first and a south wall warms early, and one normal is being asked to speak for all 150 acresreading your own microclimate →
- How close that record sits to YOUR lot — the closest Brownfields record about 3.8 miles out, measured from the town centrehow we read the record →
- Where cold air settles, which slopes face the sun, and which way the wind runs on your own ground — measured at your address, and averaged away by any Tab-wide figureread your own land →
More in Indiana
Wider growing context
What grows across IndianaTab sits outside our named growing regions, so Indiana as a whole is its closest context here.
Nearby growing guides