
Greater Boston spans USDA hardiness zones 6b-7a — enough range to grow cool-season vegetables, hardy fruit, and warm-season crops that mature before the first hard frost.
The state's dense urban core, where growing means raised beds, community plots, and back-lot kitchen gardens more than open field — a long mild season, with city soil the thing to know before you dig. These conditions suit tomato, zucchini, kale, and garlic — a starting list any specific site will trim or extend with its own soil, sun, and drainage.
Greater Boston spans Massachusetts.
Your yard isn't all of Greater Boston.
Greater Boston spans USDA zones 6b-7a, but your parcel sits in exactly one — and slope, tree cover, and low spots nudge it further. Enter your address and we'll score 1,085 plants against your land's actual soil, sun, and frost.
We read public map data around Greater Boston — soil, climate, flood, and parcel records. How we handle your address.
No card required · your parcel report in seconds — read in full free for your first 14 days
Greater Boston — the short answer
Greater Boston: USDA zones 6b-7a, 193–241 frost-free days depending where in it you stand, in Massachusetts.
- USDA zones
- 6b-7a
- USDA PHZM 2023, aggregated over the footprint
- Shortest season here
- 193 days
- NOAA Regional Climate Centers ACIS, 1991-2020 — Middlesex County
- Counties
- 3
- US Census TIGER/Line 2025
- Region type
- County cluster
- Growable Ground growing-region registry
Region boundary: Growable Ground growing-region registry — curated county clusters, EPA Level III ecoregions, and town clusters drawn finer than any county. The season figure is this region's own record, measured across its 3 member counties, not a state or national average.
Greater Boston is not one growing season
One answer for Greater Boston averages 3 counties whose growing seasons are 48 days apart — from 193 frost-free days in Middlesex County to 241 in Suffolk County. That is the same region, measured the same way, in the same years. Which end of it your land sits nearer decides what finishes before the first hard freeze.
The middle half of 3 counties runs 196–220 days, with a median of 199 days — a 48-day span end to end.
Measured across 3 member counties, each carrying its own 28°F normal. NOAA Regional Climate Centers ACIS, 1991-2020. A member with no own record is absent from the range rather than counted as zero — nothing here is interpolated to the region. Your own site sits somewhere inside this range; a parcel report resolves where.
Where the line runs inside Greater Boston
The middle half of Greater Boston runs 196–220 frost-free days, and 2 of its 3 counties sit outside that — 1 on the short side, 1 on the long. A regional planting date describes the middle well and the ends poorly, which is worth knowing before you follow one.
Under 196 frost-free days
1 county
- Middlesex County · 193 days
The end of the region that sets the planting calendar — start seed indoors here and the season stretches to meet the crop.
196–220 frost-free days
1 county
0 of 1 shown
The middle half of the region, and the part a single regional season describes well.
Over 220 frost-free days
1 county
- Suffolk County · 241 days
Long enough for a second succession of a quick crop after the first comes out.
Each county is placed by its OWN 28°F frost-free normal (NOAA Regional Climate Centers ACIS, 1991-2020), the same figure its own guide page publishes. Elevation, slope and cold-air drainage move a site within its county as well — which is the part only your address resolves.
What Grows in Greater Boston
All 2 of the plants below that publish a season requirement clear even Middlesex County’s 193 frost-free days — so on season alone, this grid works at both ends of the region. The 48-day spread still decides how far past this list you can push, and how early you can start.
Plants matched to Greater Boston's USDA zones 6b-7a, ordered by how much hardiness margin each has across the region — the ones with room to spare at both ends of this band lead. Each links to its full growing profile.
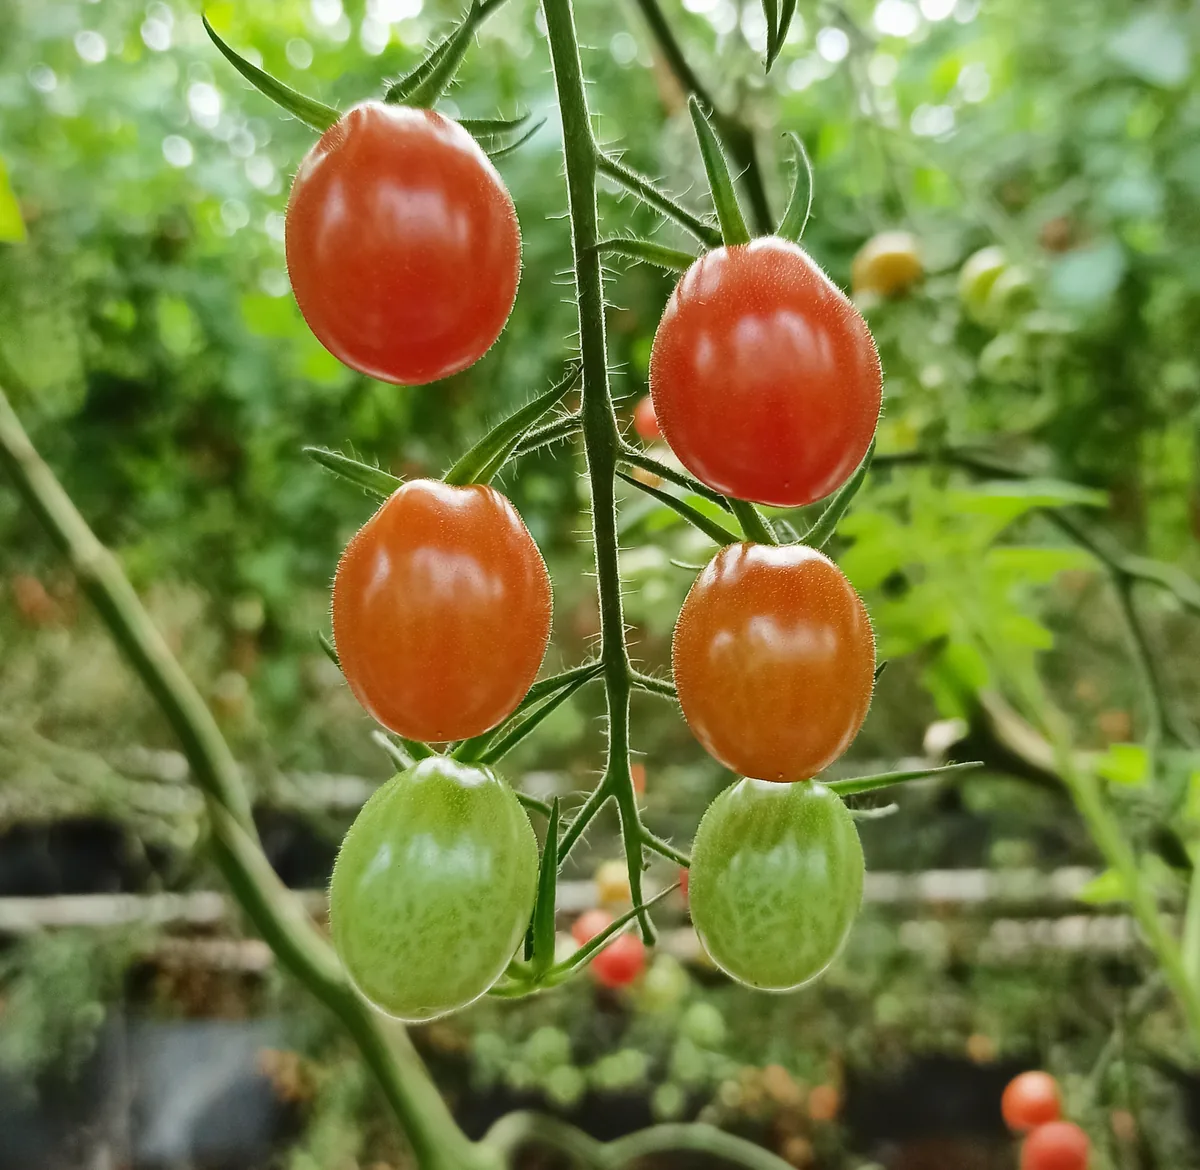
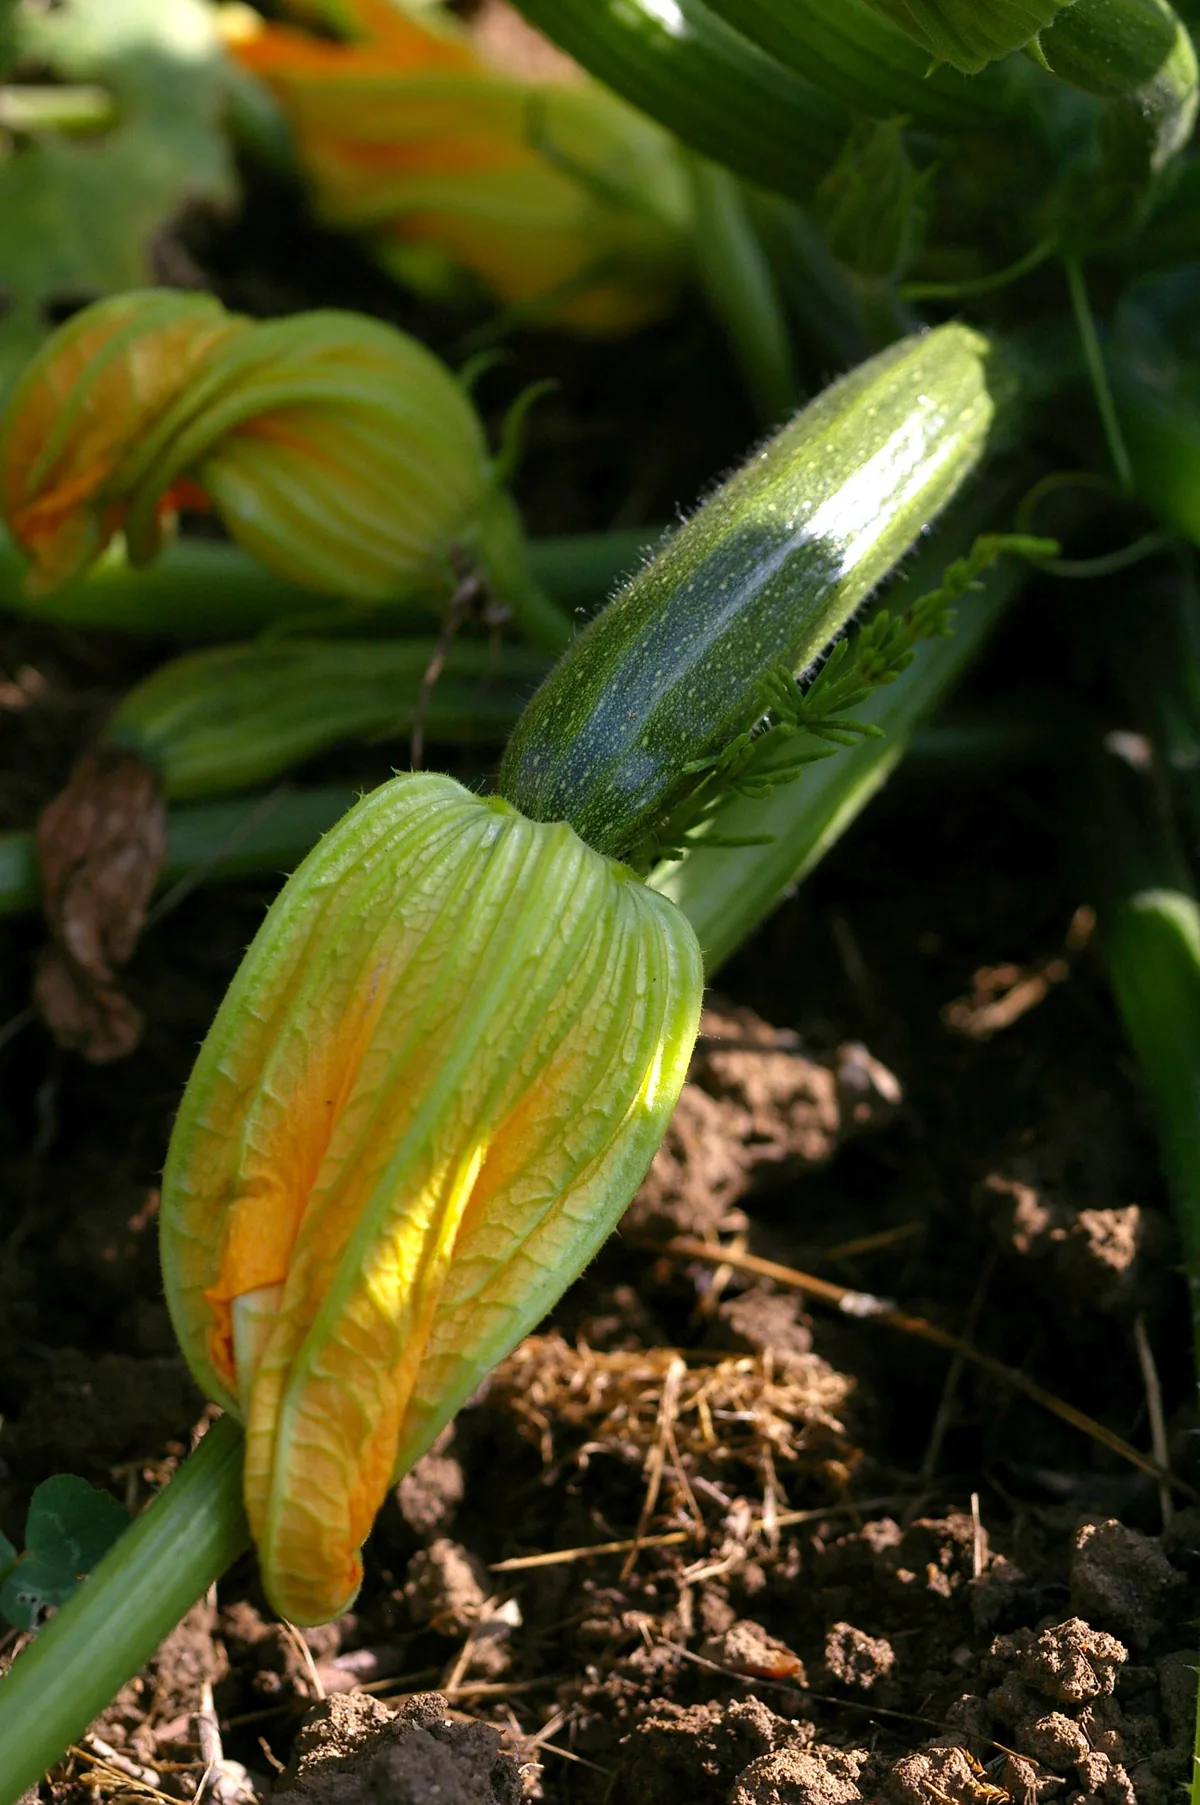
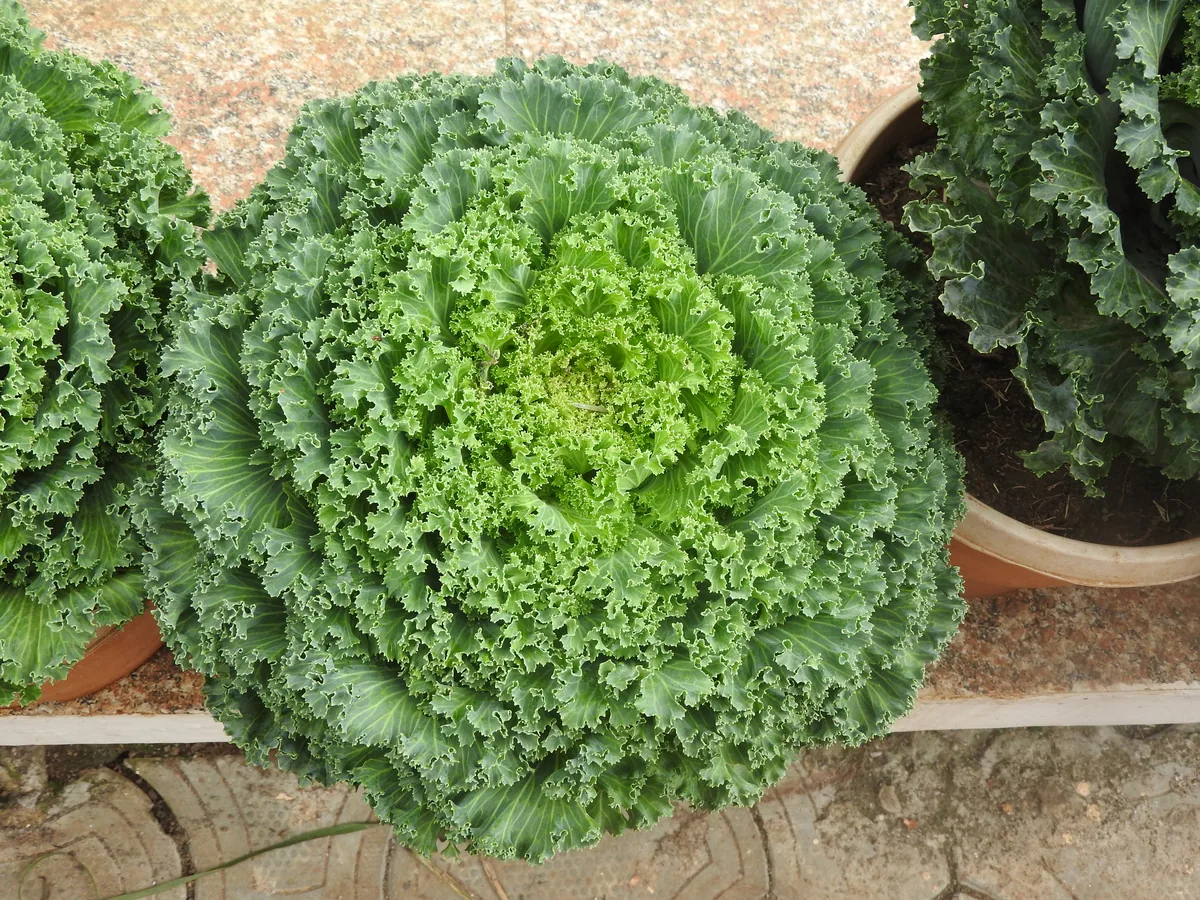
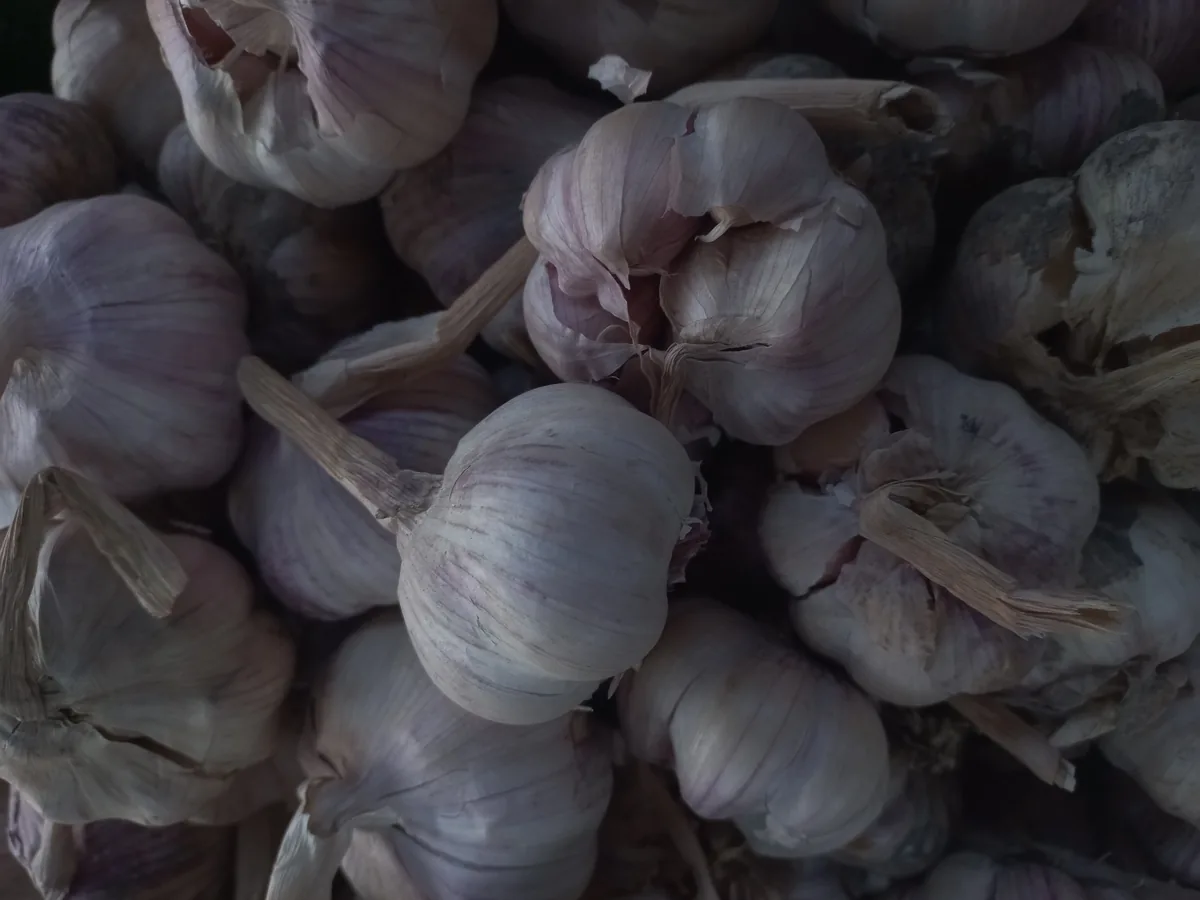
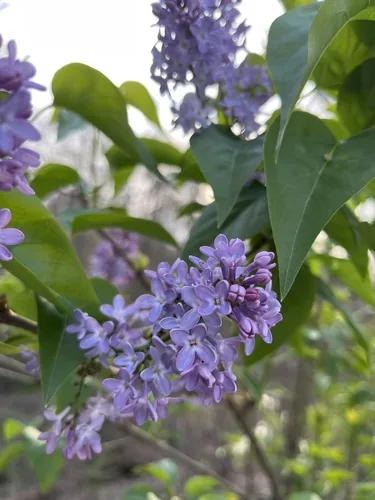
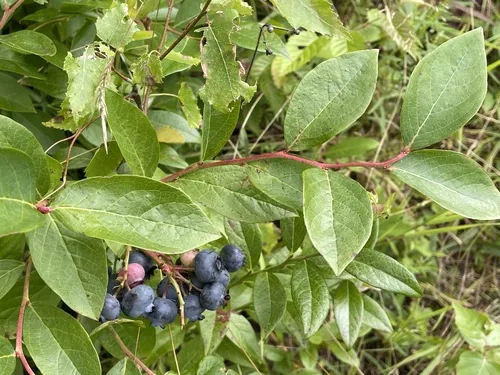
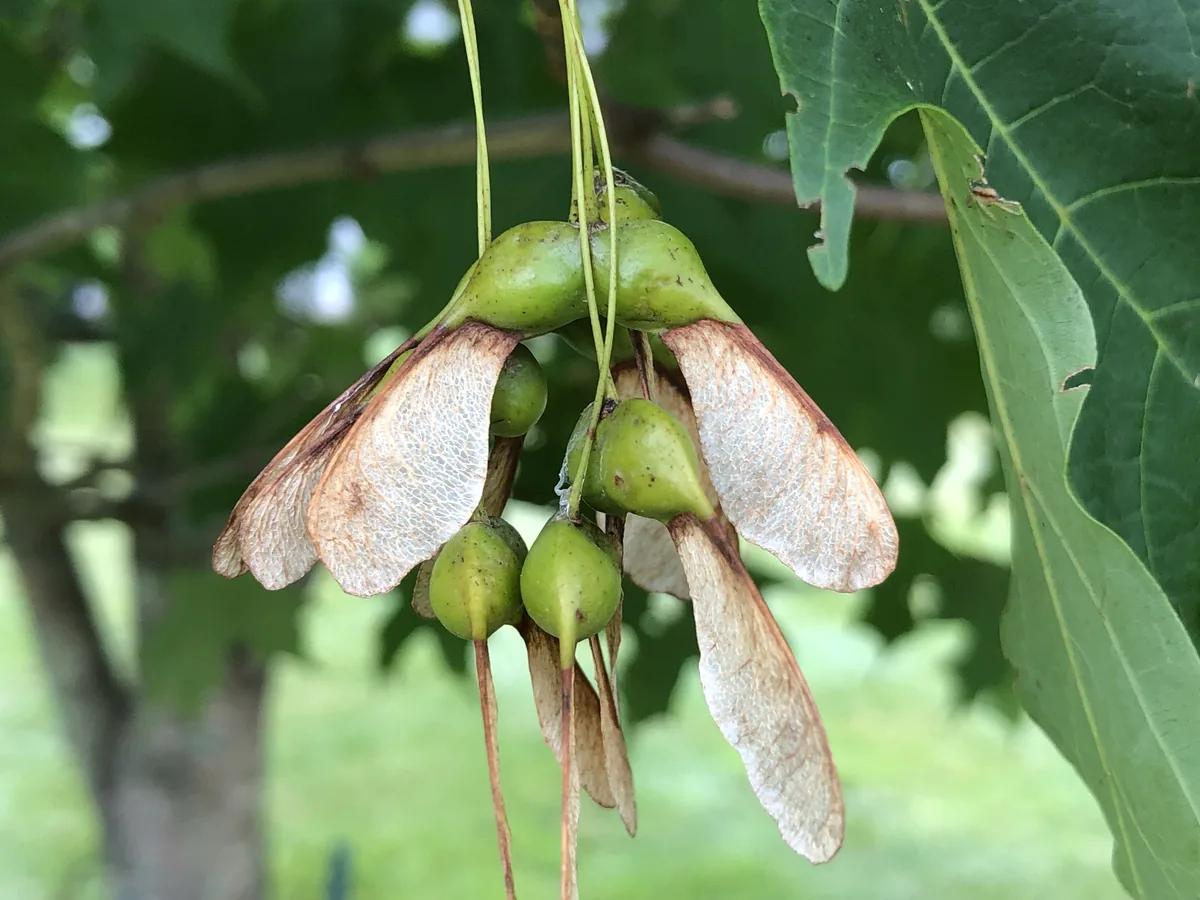
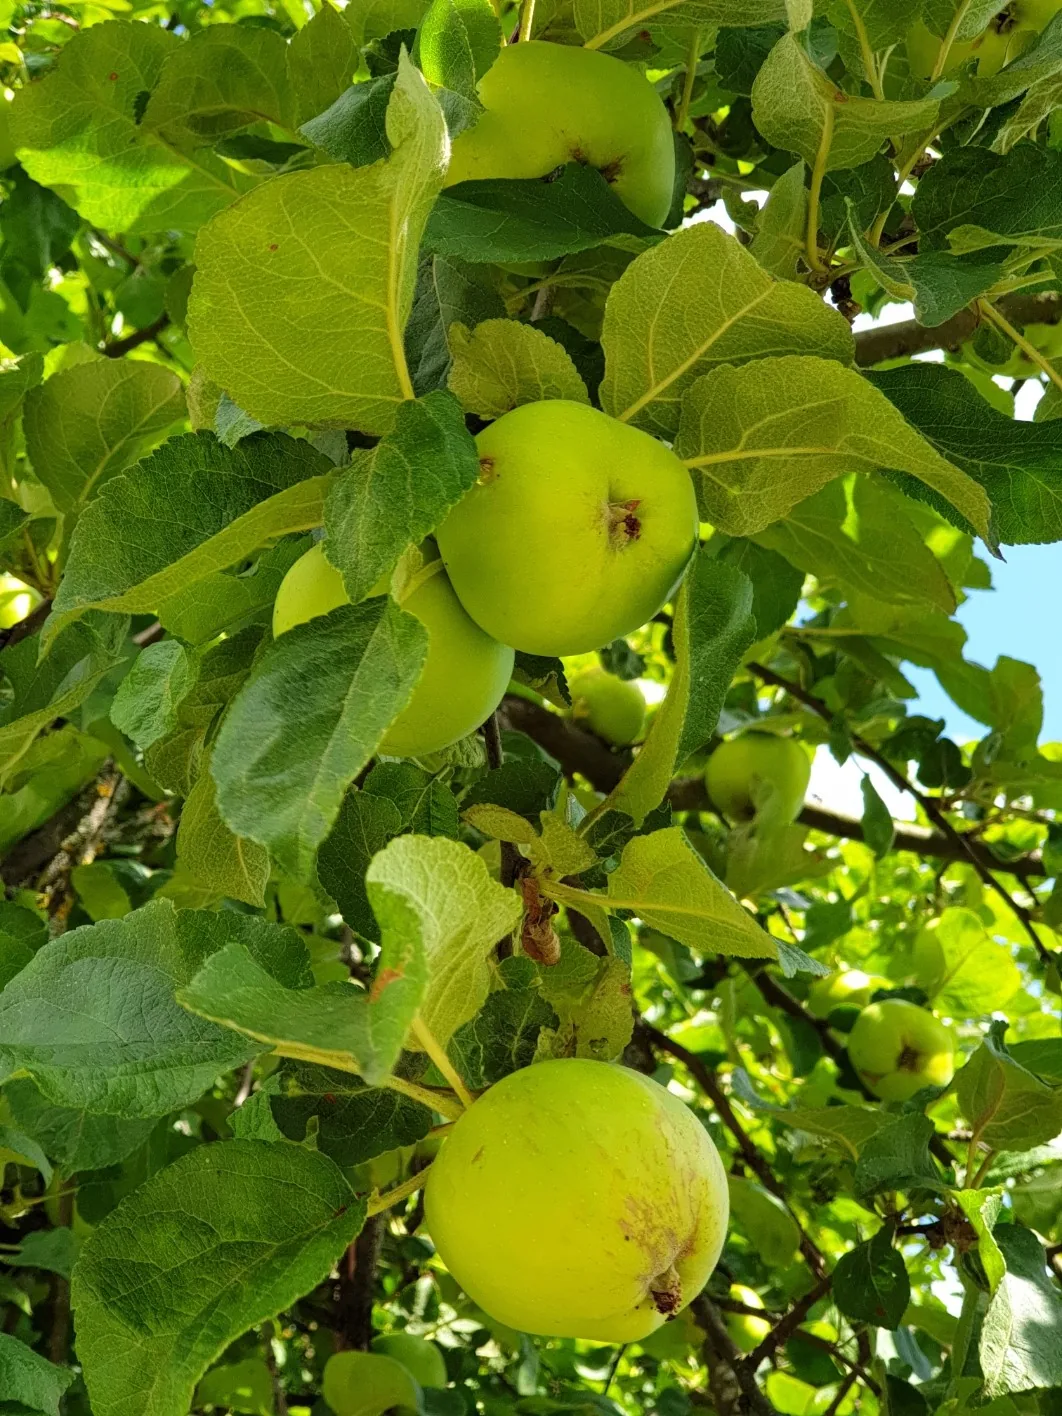
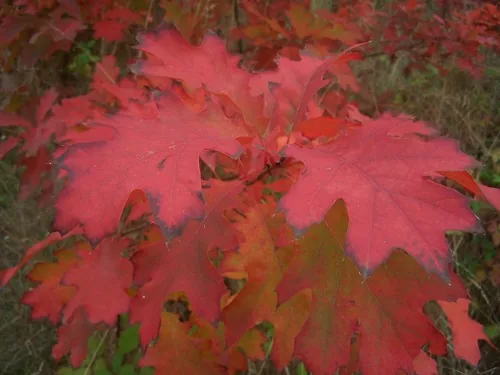
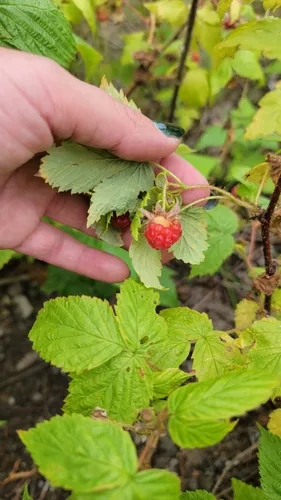
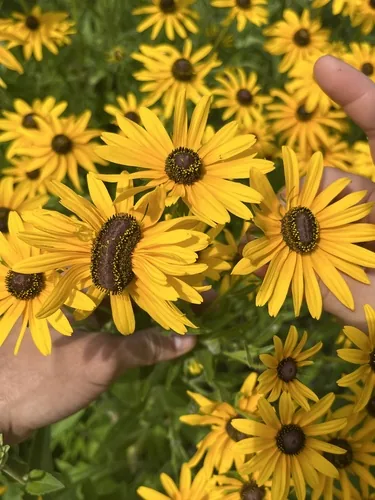
Native Plants of Greater Boston
Plants the USDA PLANTS Database documents as native and present in this region’s state, kept only where the published hardiness range meets Greater Boston’s USDA zones 6b-7a — closest range match first. Presence is recorded by state, so a plant can be documented across the state and still be scarce in your corner of the region.
The ground across Greater Boston
The USDA soil survey maps this ground county by county. These are those records weighted by land area across three member counties — this region’s own profile, not a state figure.
The ground is predominantly Inceptisols, at 66% of mapped acres, followed by Entisols (24%) and Histosols (10%). The most extensive named soils are Canton, Charlton, and Hinckley.
33% of those acres are well drained, and another 13% very poorly drained, 11% excessively drained. Topsoil pH runs 4.6–5.3 between the lowest and the highest county on record. 13% of the footprint is classed prime farmland.
Soil order
Inceptisols
Drainage
Well drained
Topsoil pH
4.6–5.3
Hydric soils
20%
Soil changes across a driveway, so which of these your own ground sits on is a parcel question rather than a regional one. Middlesex County holds the most wetland ground here, at 21% — soil types explained.
USDA NRCS SSURGO via Soil Data Access

What this means for growing in Greater Boston
The soil survey reads this ground county by county, and the readings above are those records summed across Greater Boston. Here is what they mean for a garden here — and the move an experienced grower makes about each one.
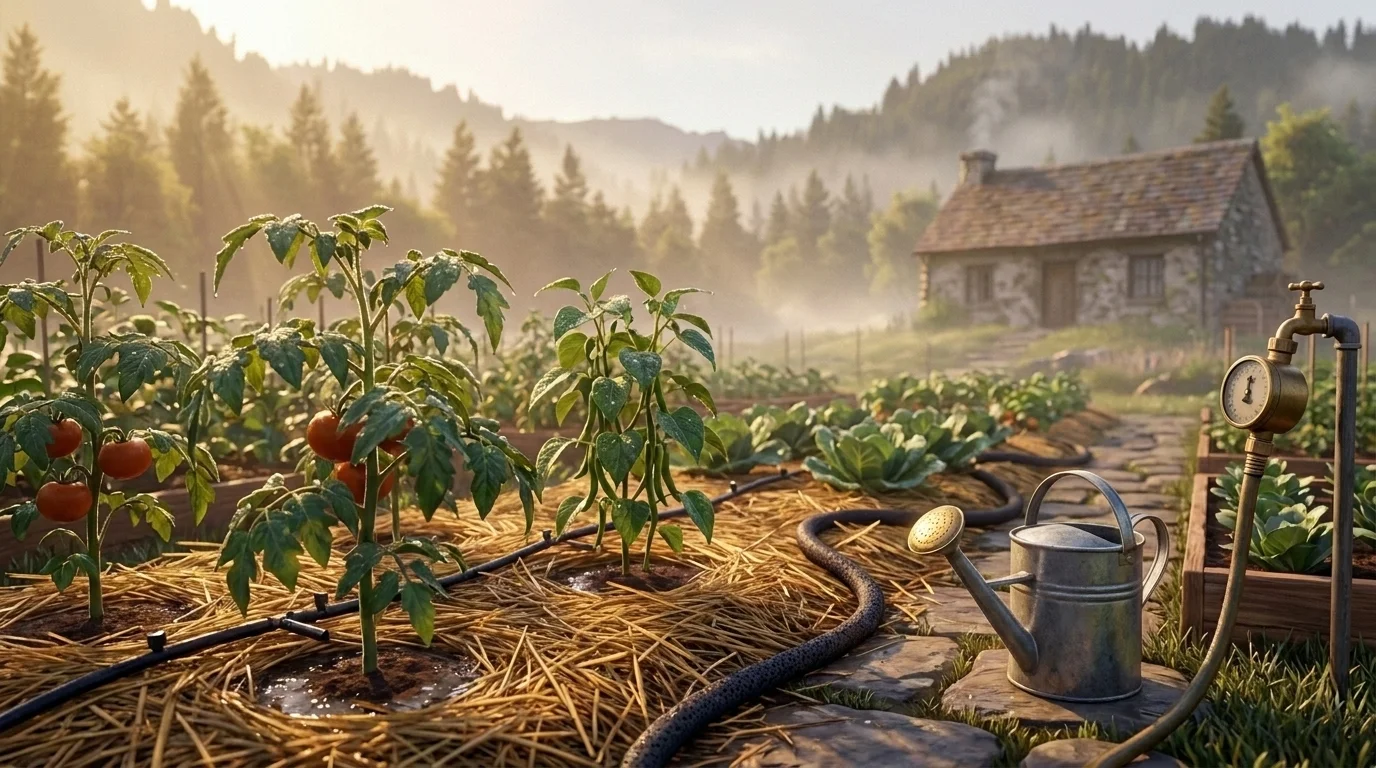
Drainage
From county records33% of the mapped acres across Greater Boston are well drained — ground that drains quickly. That is area-weighted across all three of its mapped counties.
The upside is soil you can work early in spring and roots that never drown; the cost is that fast-draining ground dries out fast and leaches nutrients away before plants can use them.
Work in compost and mulch to hold moisture and feed, and water more often in short doses than deep and rarely.
USDA NRCS SSURGO
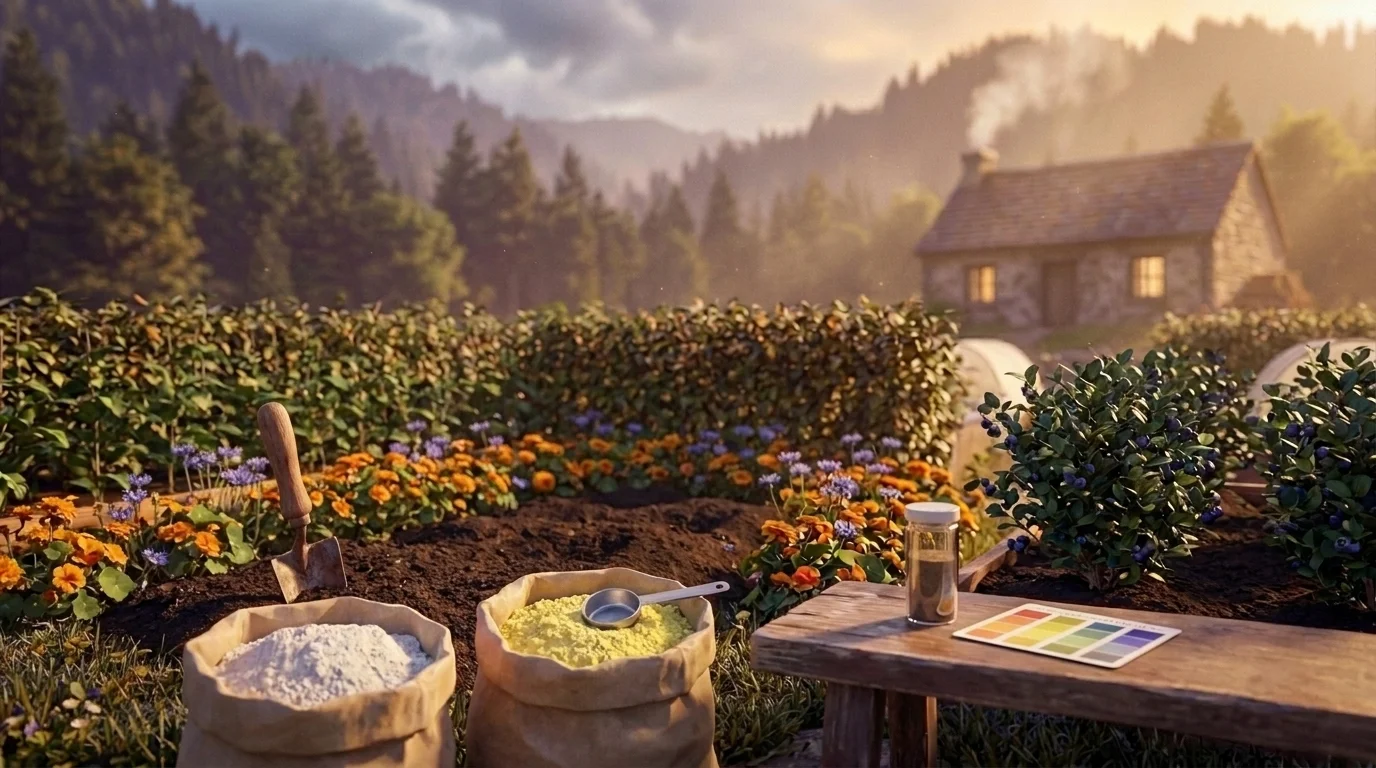
Surface pH
From county recordsTopsoil across Greater Boston runs pH 4.6–5.3 — acidic in all three of them.
Blueberries, potatoes, and rhododendrons thrive in it, but most vegetables start locking out nutrients below about pH 6.0 and grow pale and stunted no matter how much you feed them.
A measured lime application raises pH for the crops that need it — but test first, because the right rate depends on your own soil, not the county average.
USDA NRCS SSURGO
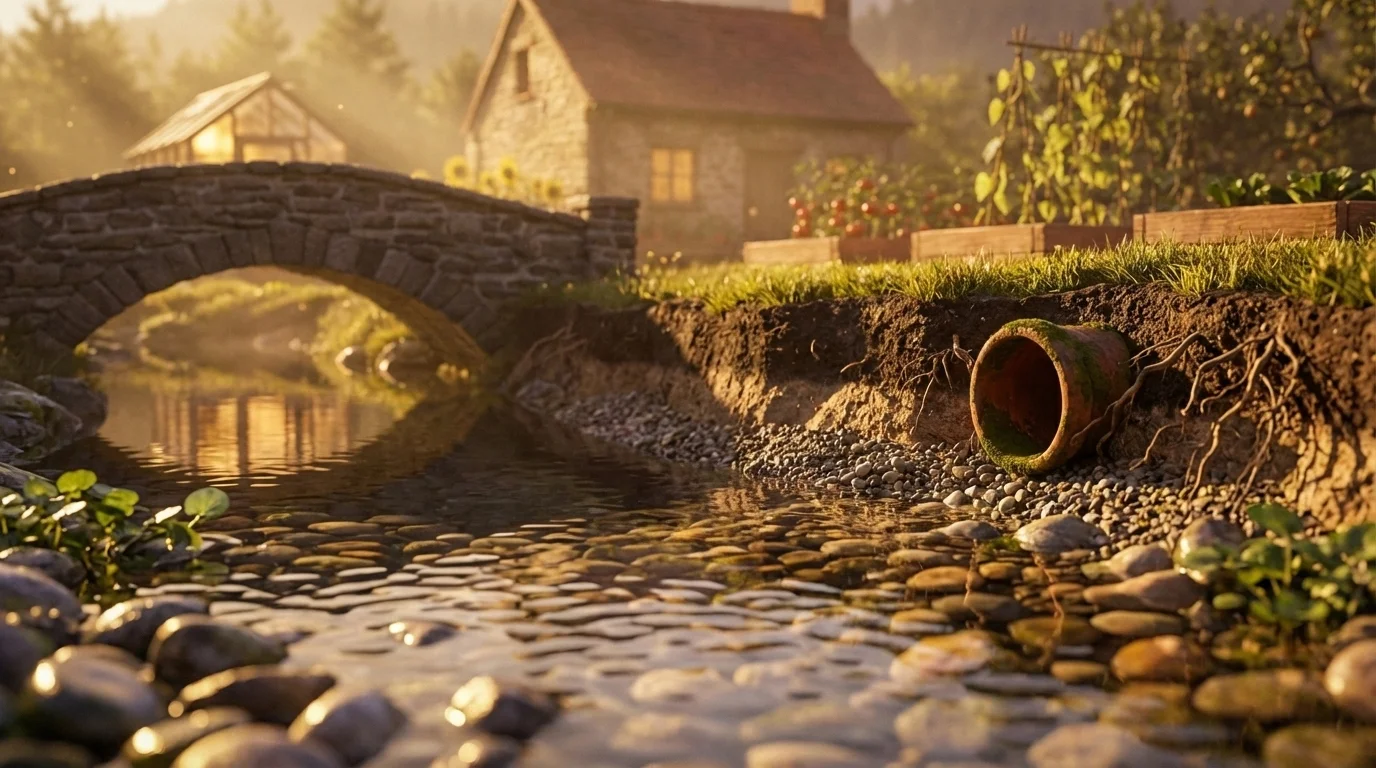
Wet ground
From county recordsAbout 20% of the ground across Greater Boston is mapped as hydric — wetland — soil. Middlesex County carries the most, at 21%.
If your lot falls in one of those pockets, a standard in-ground bed will fight waterlogging all season, and roots that need air will struggle.
Check how your own ground drains before you dig; raised beds or moisture-loving plantings turn a wet corner from a problem into a niche.
USDA NRCS SSURGO
 Safe to Grow Here?
What the federal record shows across Greater Boston — and how to grow with it.
Across Greater Boston's 3 counties the federal record holds 15,126 documented sites, mostly Brownfields (10,228), Underground Storage Tanks (3,629) and Toxics Release Inventory (649). The heaviest single county is Middlesex County, with 8,635.
That is a regional count, not a reading of any one lot — proximity to a documented site is information, not a diagnosis. Open the map outlined to Greater Boston to see which records sit where you actually grow.
Sources Checked
Summed across the 3 counties in Greater Boston
A note from Gnorman
What an experienced grower watches for around here
In and around Greater Boston, Brownfields runs higher than the national average — 10,228 sites across the 3 counties in Greater Boston. Knowing it is half the work — and it's nothing a thoughtful grower can't plan for.
Brownfields: Brownfield sites are former commercial or industrial properties that EPA’s Brownfields program (ACRES) has assessed or funded cleanup on.
Contact the EPA Brownfields program or the state cleanup agency for this site’s actual assessment/remediation status — ACRES itself does not publish one we can read per site.
Sources: EPA, USGS — 1.8M documented sites tracked nationwide across 8 federal source types.
Your land is one point inside Greater Boston
Everything above resolves to Greater Boston as a whole — a footprint whose own counties record seasons 48 days apart, and hardiness across zones 6b-7a. Your parcel sits at one point in that range, not in the middle of it. Slope, tree cover, a low spot that pools cold air, and what is in the soil are all resolved at the address, and none of them are visible at region scale. That is the honest boundary of this page, and the reason the next step is a reading of your own ground rather than a better regional average.
Your Lot vs Greater Boston Average
Greater Boston Average
- ●USDA Zones 6b-7a, averaged across Greater Boston
- ●One soil character for all of Greater Boston
- ●State-average frost dates
YOUR Parcel
- ✓Your exact zone, not Greater Boston's 6b-7a
- ✓Your SSURGO soil type & pH
- ✓Your sun exposure, cast in 3D
See MY Growing Report
Read your parcel in Greater Boston
Pull a site-specific report for your exact address in Greater Boston — soil, sun, drainage, frost risk, contamination, and scored plant recommendations.
Three things about your lot that Greater Boston averages can't show:
We read public map data around Greater Boston — soil, climate, flood, and parcel records. How we handle your address.
25+ data sources read at your address, not Greater Boston average
How we know this about Greater Boston
The boundary: a cluster of neighboring counties. Growing regions have no official boundary, so this footprint is our published one, and every figure on this page was measured over the counties inside it rather than borrowed from the state around it.
The datasets: hardiness from the USDA ARS Plant Hardiness Zone Map 2023, aggregated across the footprint; the growing season from NOAA Regional Climate Centers ACIS 1991–2020 28°F normals, read at each member’s own record; boundaries from US Census TIGER/Line 2025; the contamination record from the federal sources named in that beat above; the soil from the USDA NRCS SSURGO survey, read at each member county’s own record and weighted to this footprint by land area. Where a member carries no record of its own, it is absent from the figure rather than filled in.
Common questions about Greater Boston
What hardiness zone is Greater Boston?
Greater Boston spans USDA hardiness zones 6b-7a, aggregated from the USDA Agricultural Research Service Plant Hardiness Zone Map 2023 across the region's counties. Zones reflect average annual extreme minimum temperatures from 1991–2020 data.
How long is the growing season in Greater Boston?
Measured between 28°F hard freezes, Greater Boston's counties mostly run 196 to 220 frost-free days, median 199 (NOAA Regional Climate Centers ACIS, 1991–2020, over 3 member counties). That 24-day spread is the honest read — no single season describes 3 counties, and each county guide below carries its own.
When does frost risk end in Greater Boston?
Across Greater Boston, the middle half of member counties see their last 28°F hard freeze between Apr 4 and Apr 12 (median Apr 10), and their first fall freeze between Oct 25 and Nov 10. Those are hard freezes, not the last light frost: tender transplants wait for about May 1, and elevation decides which end of a 8-day spread you garden in.
What grows well in Greater Boston?
Greater Boston's conditions suit plants such as Tomato, Zucchini, Kale, Garlic, Lilac, Blueberry. What actually thrives on any one site still turns on its specific soil, sun, and drainage — we score each plant against the real conditions at your address.
How is Greater Boston defined?
Greater Boston is defined here as a curated cluster of 3 neighboring counties that share a growing character. Growing regions have no official boundary, so this footprint is our published one — every county in it is named on this page.
Which states does Greater Boston cover?
Greater Boston spans Massachusetts. Each state's full growing guide is linked on this page.
What other growing regions cover the same states?
Cape Cod & the Islands, Pioneer Valley, The Berkshires, Central Massachusetts, North Shore, and South Shore share at least one state with Greater Boston. Growing regions overlap and interlock — a single address can sit inside more than one, which is why the precise read is always the parcel, not the region.
What this page reads at Greater Boston’s own scale
6 of the readings below were taken at Greater Boston's own scale — the zone 6b-7a band across its footprint, a median 199-day season across its 3 counties and 15,126 documented federal contamination records across its 3 counties, 8,635 of them in Middlesex County alone; one is borrowed from a wider read, named and linked below.
Measured here
- The USDA hardiness band 6b-7a aggregated across all 3 counties in the footprintUSDA PHZM 2023
- The boundary itself — the 3 counties this region is curated fromGrowable Ground subregion registry
- The growing character that makes this region distinct from the states it crossesGrowable Ground subregion registry
- The 28°F season across the footprint — the middle half of its 3 counties run 196 to 220 frost-free days, median 199NOAA Regional Climate Centers ACIS, 1991-2020
- The federal contamination record over the whole footprint — 15,126 documented federal contamination records across its 3 counties, 8,635 of them in Middlesex County aloneEPA, USGS and USDA federal site records
- The soil order mix across the footprint — 66% Inceptisols, topsoil pH 4.6–5.3, area-weighted across its 3 mapped countiesUSDA NRCS SSURGO
Inherited from a wider read
- The candidate plant list — its state's curated sets, merged and filtered to zones 6b-7afrom Massachusetts
What this page can’t tell you
- Which end of the 24-day range your ground sits at — 196 days at one extreme, 220 at the other, decided mostly by elevationfrost dates explained →
- Which of those soils your own ground sits on — the survey maps them county-wide, and they change across a drivewaysoil types explained →
- The soil pH, drainage, sun hours, and frost pockets on one specific lotwhy one lot differs from the next →
Explore Greater Boston
State growing guides
Counties in this region
Other growing regions across Massachusetts
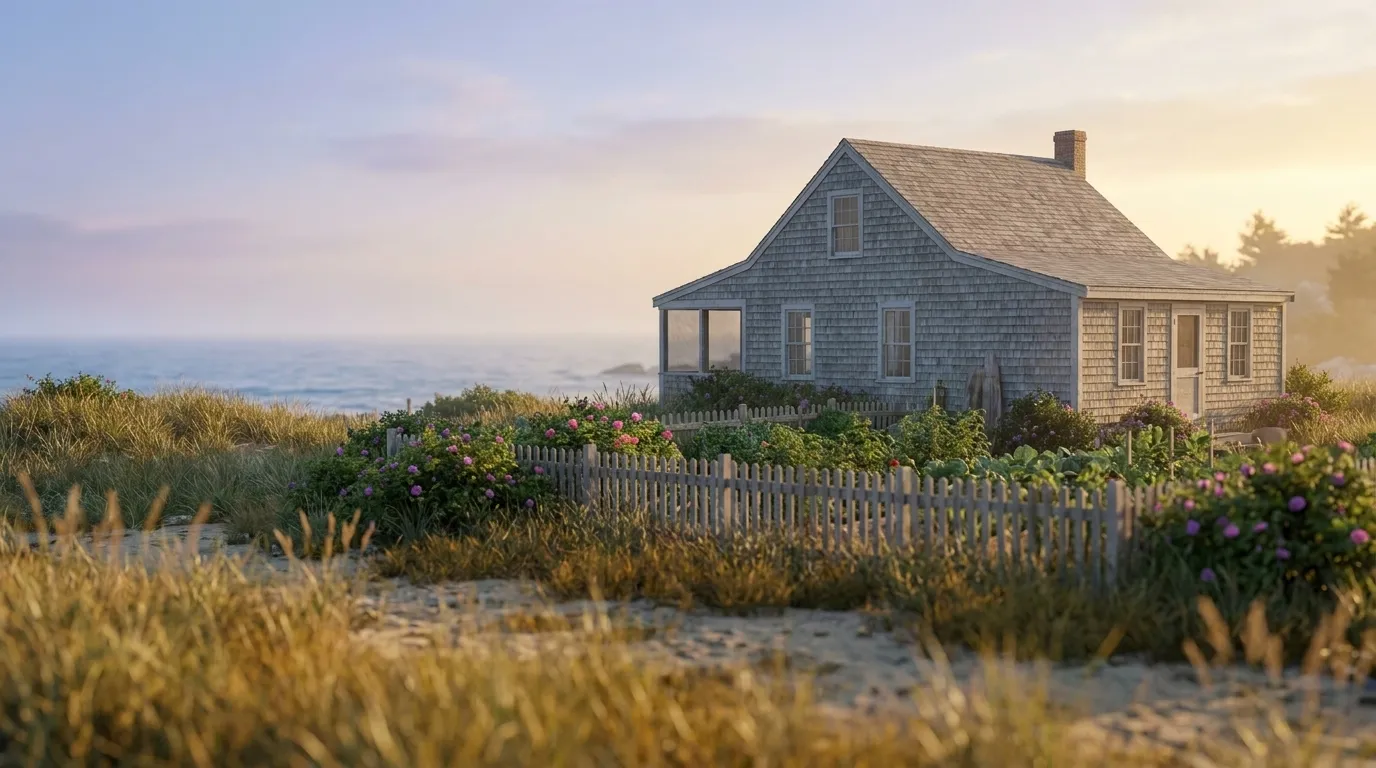
A sandy, maritime-tempered peninsula and islands with acidic soils long worked for cranberries, beach plums, and salt-tolerant kitchen gardens.
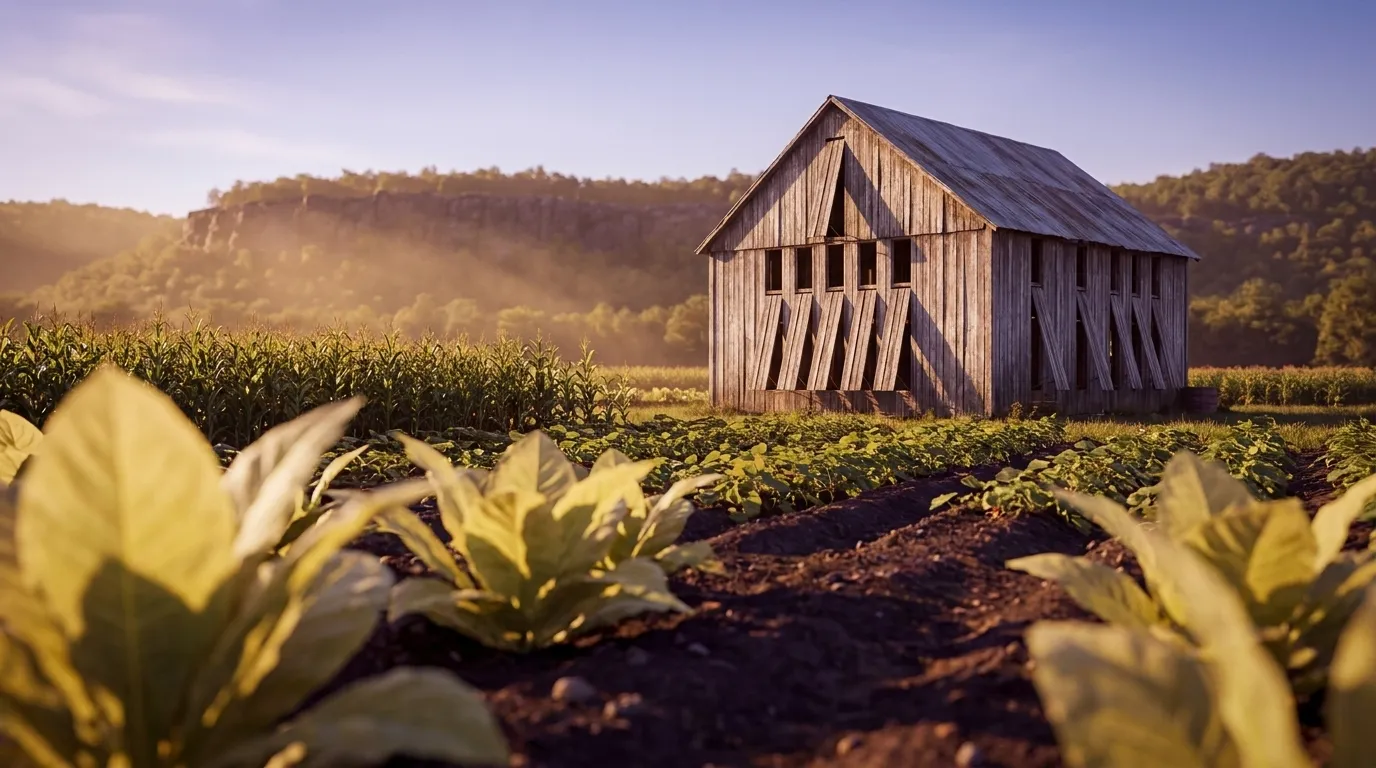
The Connecticut River's broad valley floor and the richest farm ground in the state — deep alluvial soils and a warmer pocket than the hills on either side, long worked as market-garden and tobacco country.
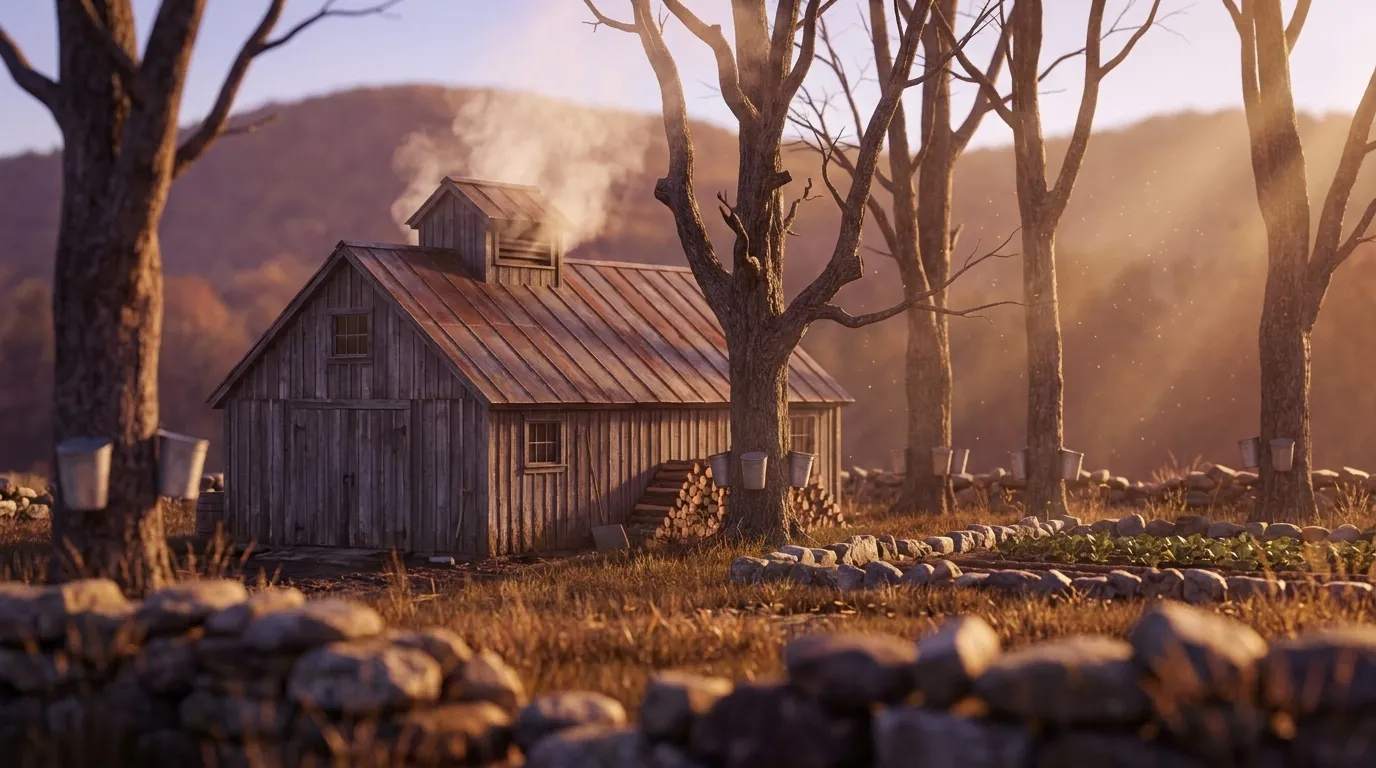
Western Massachusetts' cool, hilly uplands of rocky glacial soils and a short season suited to apples, maples, and cold-hardy market gardens.
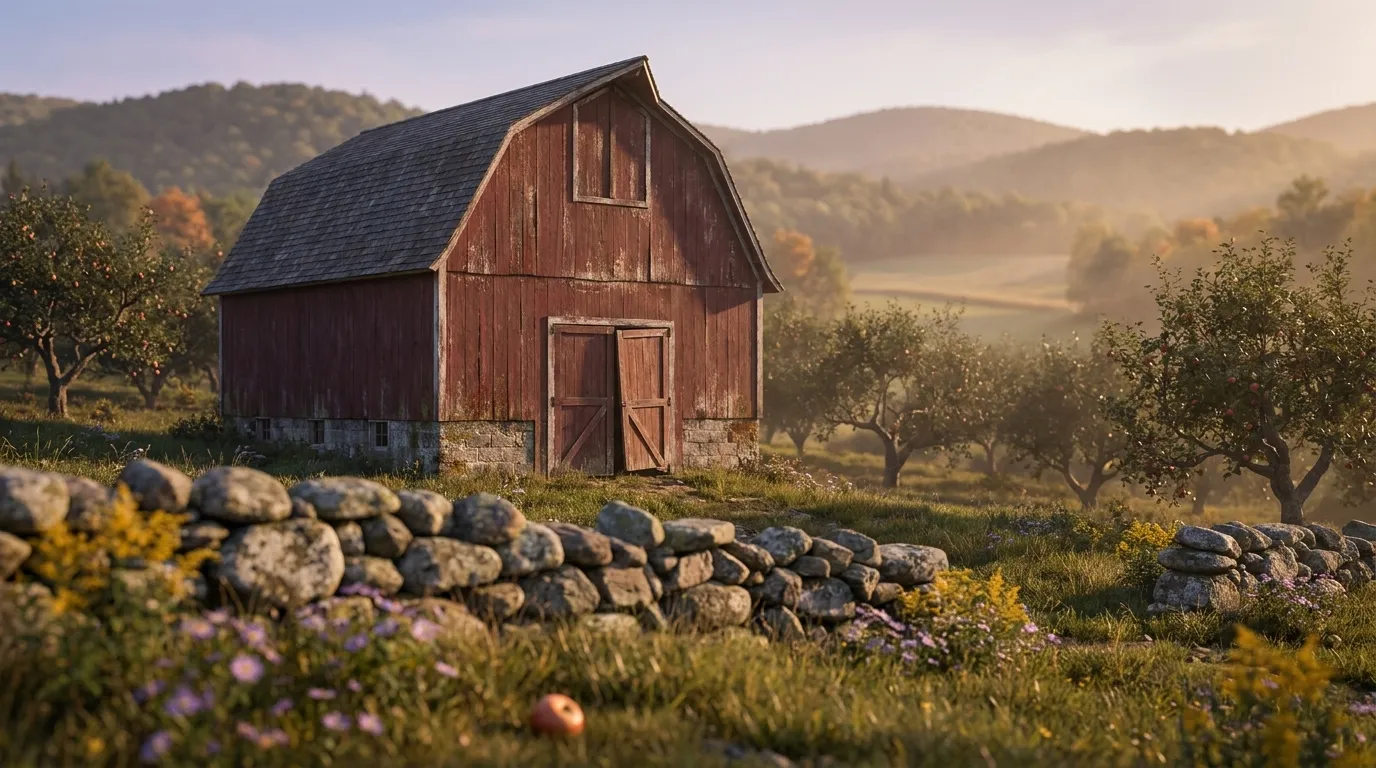
The inland heart of the state — rolling upland, cooler nights, a shorter season than the coast, and stony glacial soils that reward the gardener who feeds and drains them.
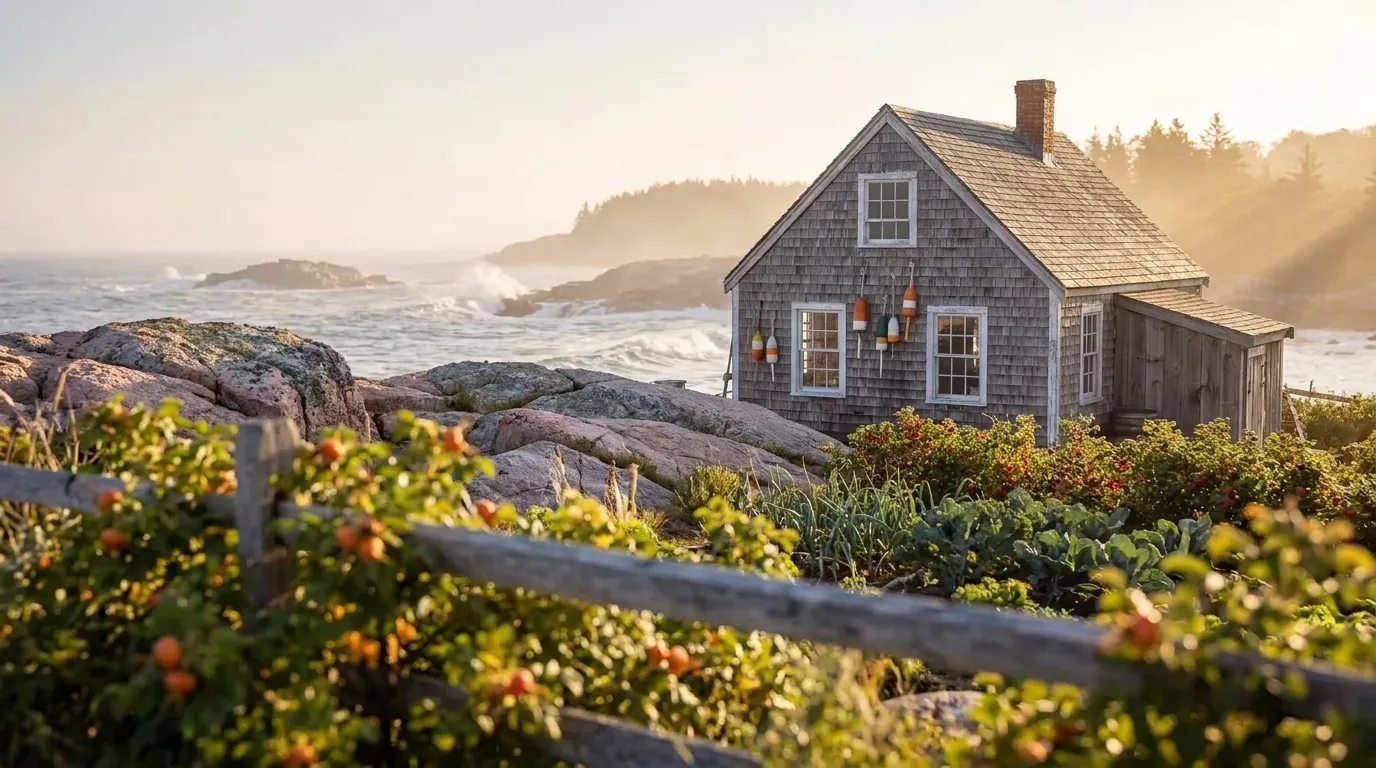
The settled coast north of Boston — salt air, tidy town lots, and sea-tempered winters that hold the cold off a little longer than the hills inland.
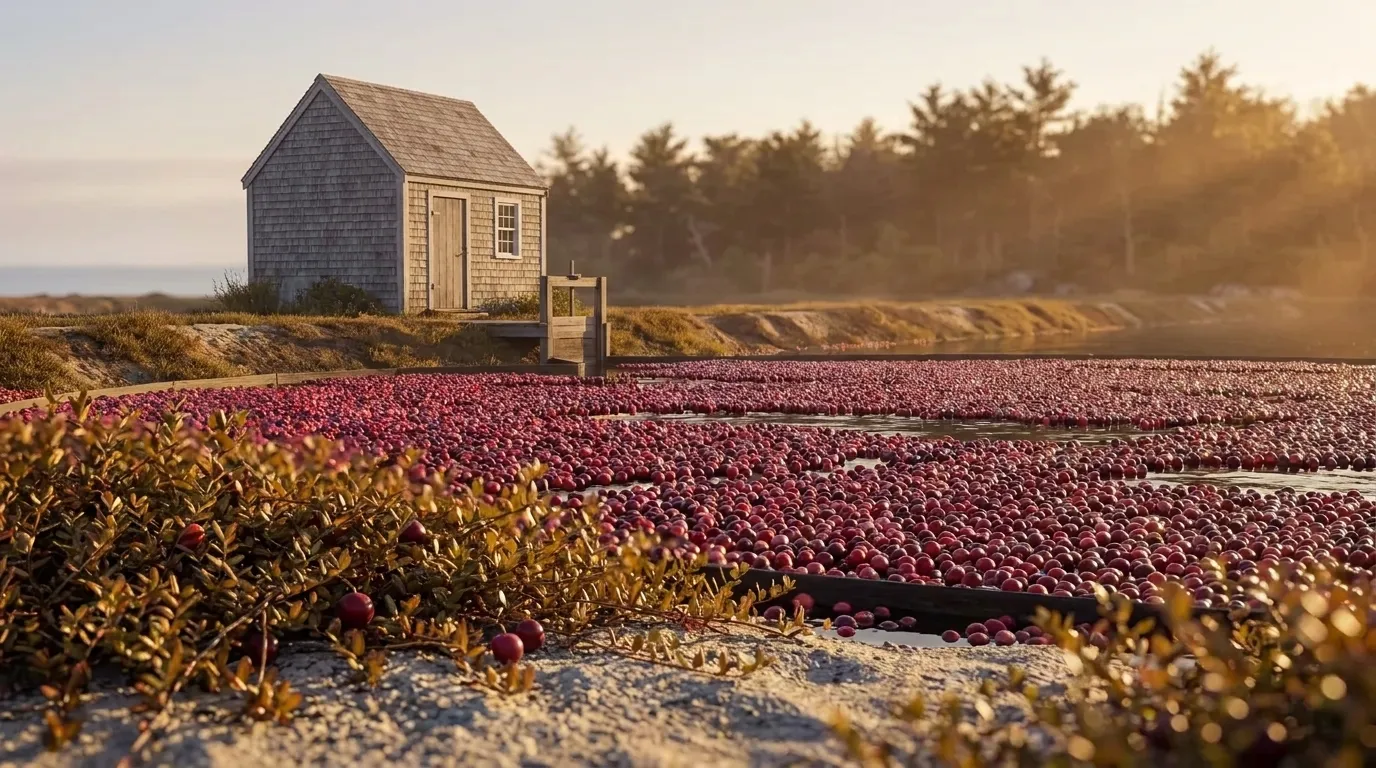
The coastal band south of Boston into old cranberry country — sandy, acidic ground and a maritime season that runs a touch longer than the interior.