
The Lake Erie Shore (Ohio North Coast) spans USDA hardiness zones 6b-7a — a zone band wide enough that plant choice, not possibility, is the interesting question.
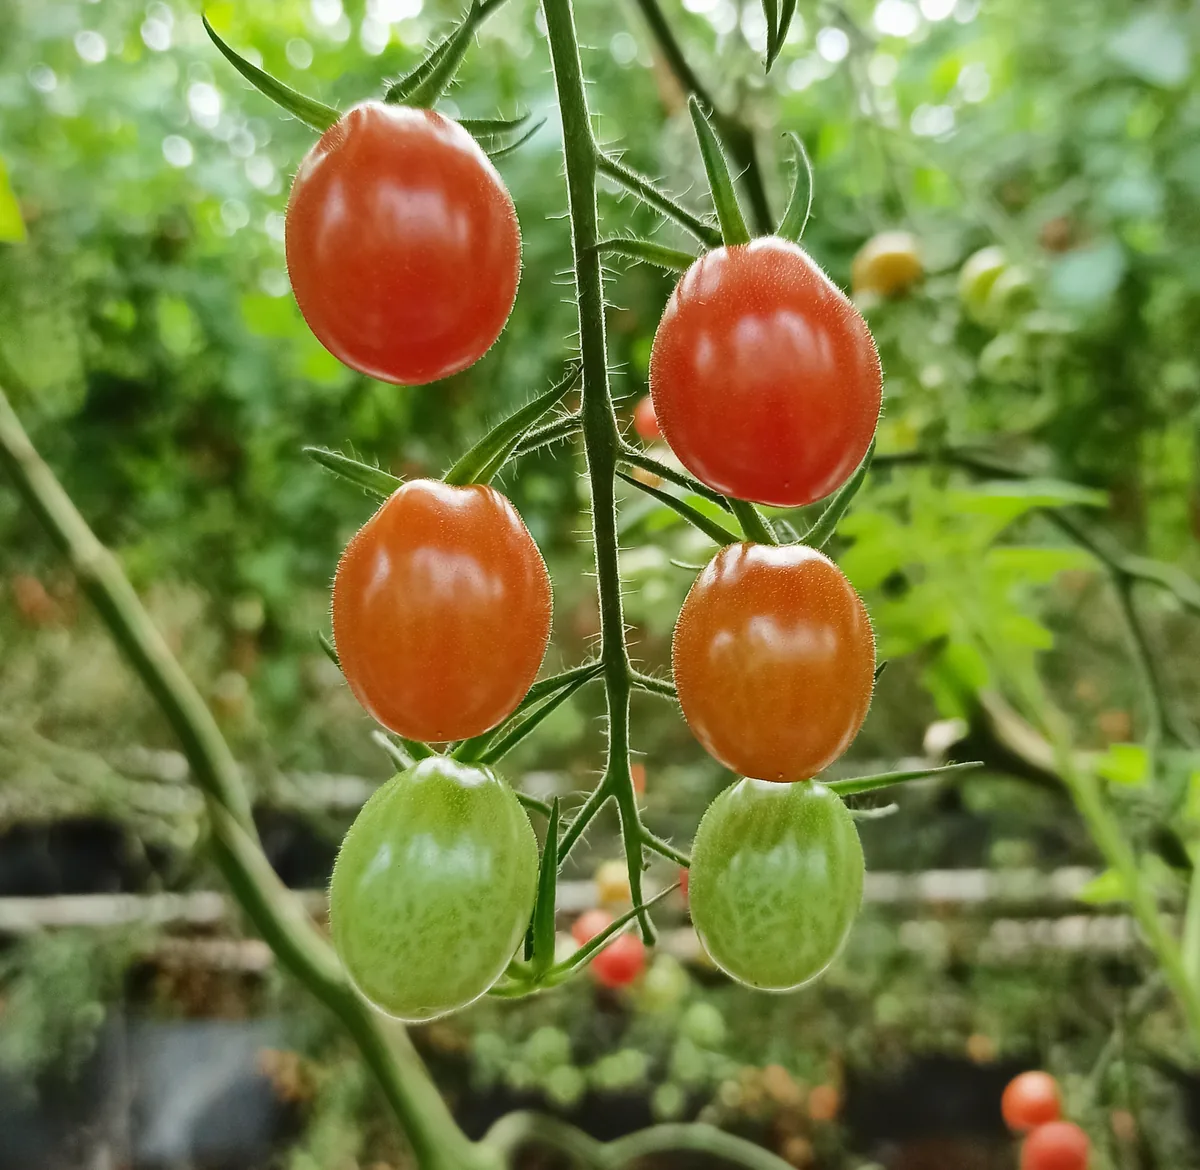
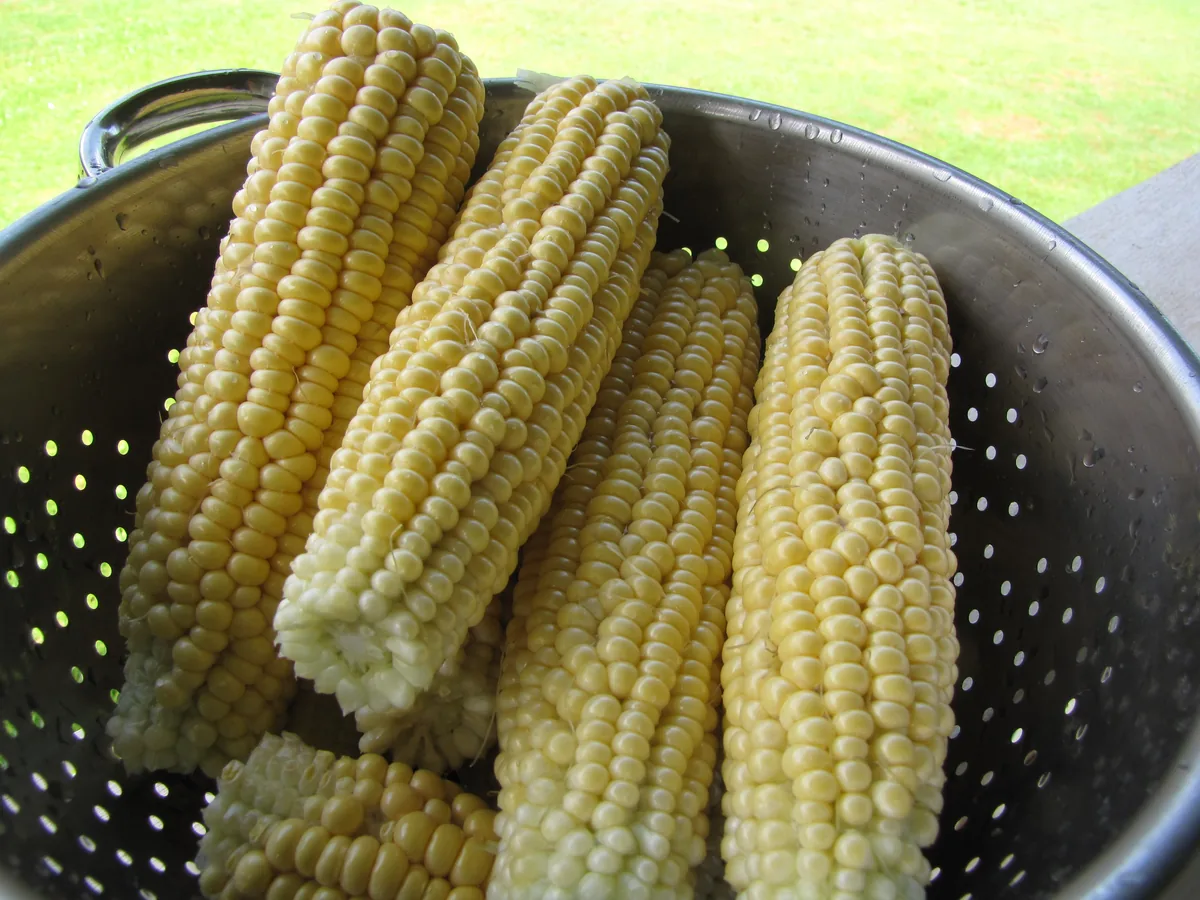
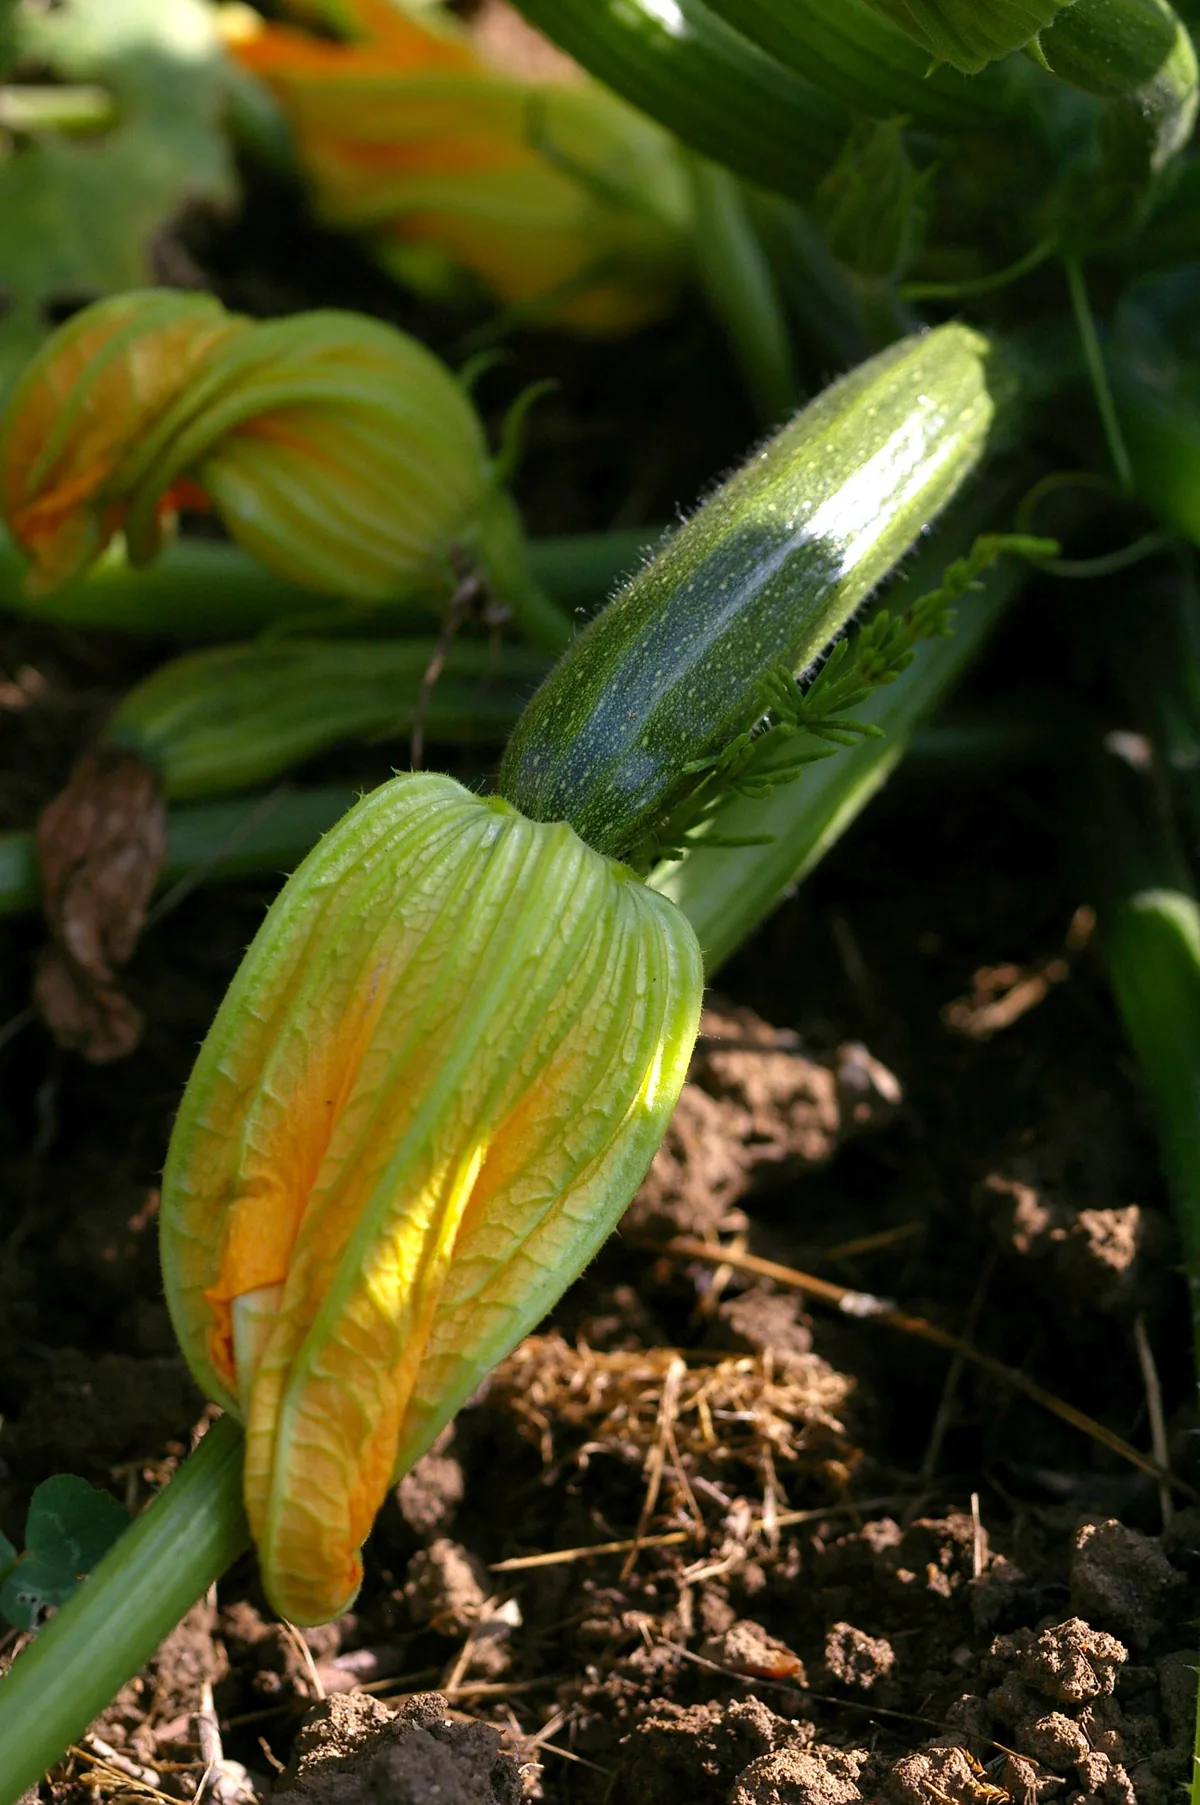
Ohio's warmest, longest-season ground — and the only stretch of the state that reaches USDA 7a on its north side. Lake Erie soaks up summer heat and releases it slowly, holding off spring and fall frost and pushing the frost-free window to 224-239 days along the shore ribbon from Toledo through Cleveland to the Ashtabula lake tier, versus roughly 208 across the corn-belt interior just inland — a two-to-four-week head start on tender crops. It is federally recognized wine country for the same reason (the Lake Erie AVA, 27 CFR 9.66, plus the Grand River Valley and Isle St. George appellations), and the vegetable-and-tomato belt around Sandusky Bay works the identical lake buffer. A grower on Kelleys Island or in Lakewood can set out warm-season plants weeks before the flat 6a plains a few miles south can hold them. The conditions favor tomato, sweet corn, zucchini, and apple, among others — though every individual site edits that list with its own soil, sun, and drainage.
The Lake Erie Shore (Ohio North Coast) spans Ohio.
Your yard isn't all of the Lake Erie Shore (Ohio North Coast).
The Lake Erie Shore (Ohio North Coast) spans USDA zones 6b-7a, but your parcel sits in exactly one — and slope, tree cover, and low spots nudge it further. Enter your address and we'll score 1,085 plants against your land's actual soil, sun, and frost.
We read public map data around Lake Erie Shore (Ohio North Coast) — soil, climate, flood, and parcel records. How we handle your address.
No card required · your parcel report in seconds — read in full free for your first 14 days
The Lake Erie Shore (Ohio North Coast) — the short answer
The Lake Erie Shore (Ohio North Coast): USDA zones 6b-7a, 224–239 frost-free days, in Ohio.
- USDA zones
- 6b-7a
- USDA PHZM 2023, aggregated over the footprint
- Frost-free season
- 224–239 days
- NOAA Regional Climate Centers ACIS, 1991-2020
- Counties
- 7
- US Census TIGER/Line 2025
- Region type
- County cluster
- Growable Ground growing-region registry
Region boundary: Growable Ground growing-region registry — curated county clusters, EPA Level III ecoregions, and town clusters drawn finer than any county. Where a region publishes no measured season, no season figure is shown.
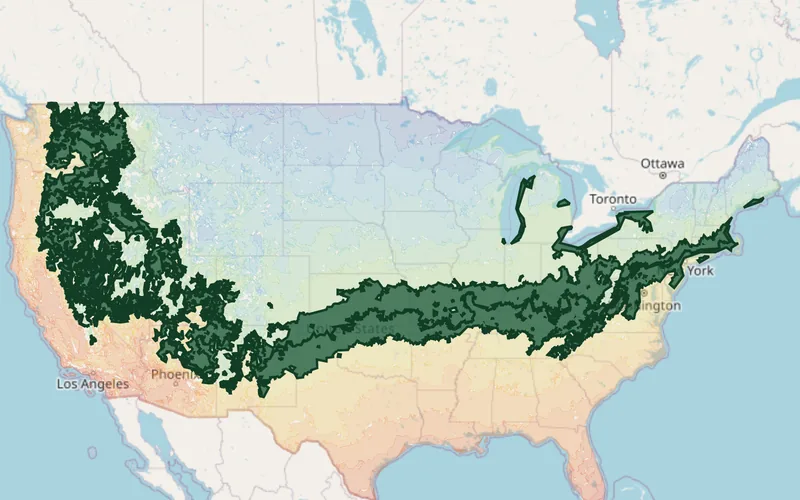
What Grows in the Lake Erie Shore (Ohio North Coast)
Plants matched to the Lake Erie Shore (Ohio North Coast)'s USDA zones 6b-7a, ordered by how much hardiness margin each has across the region — the ones with room to spare at both ends of this band lead. Each links to its full growing profile.
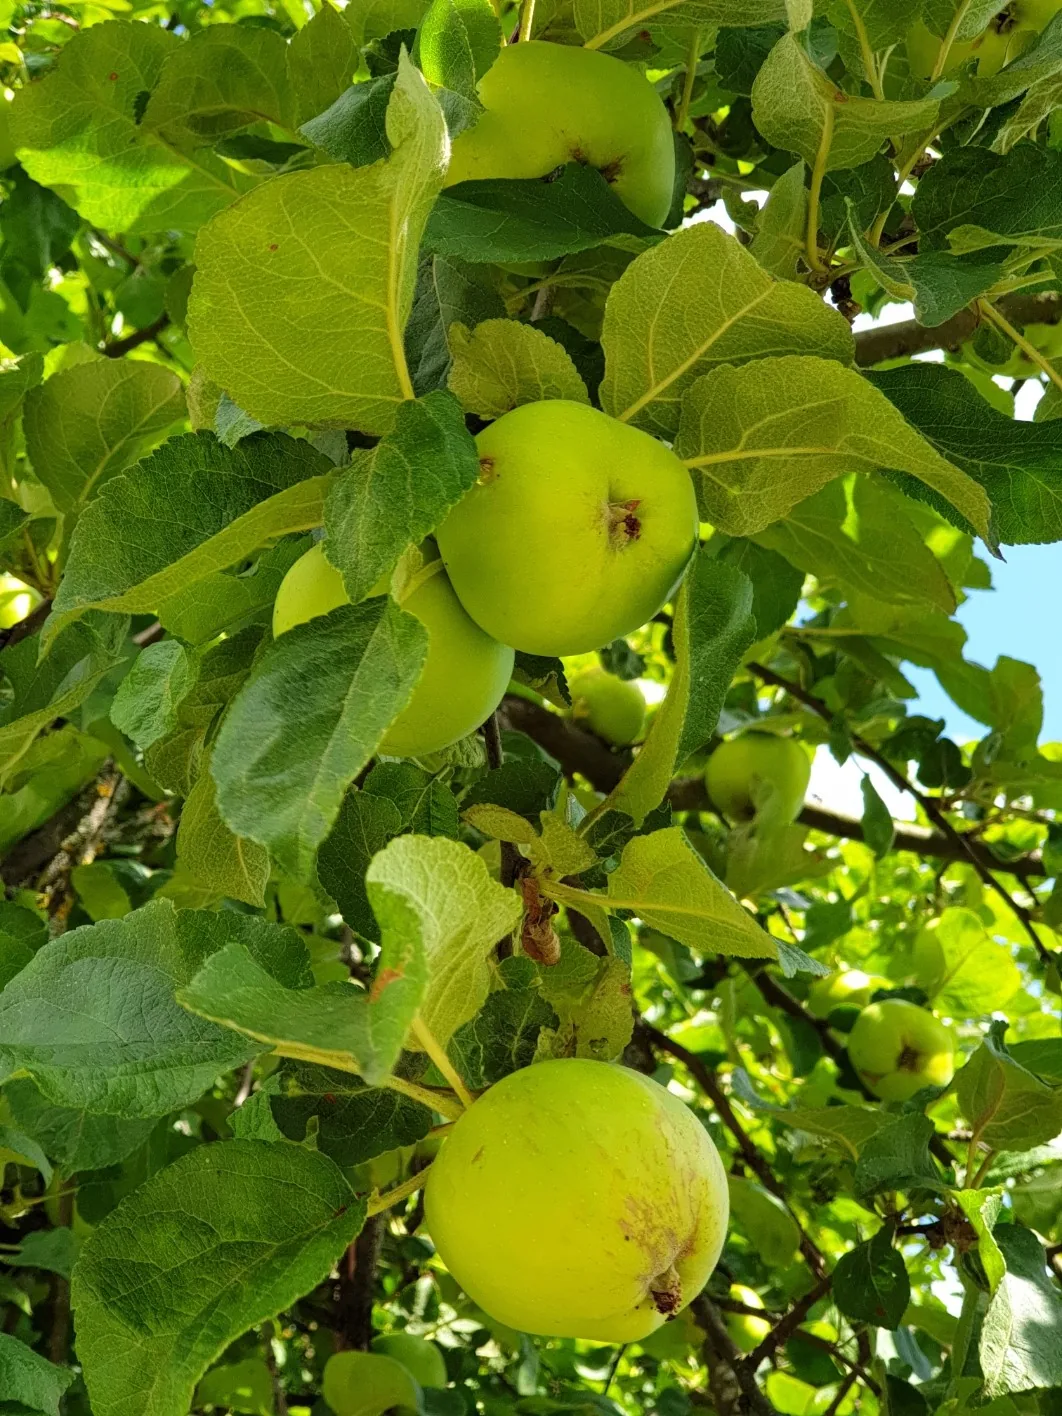
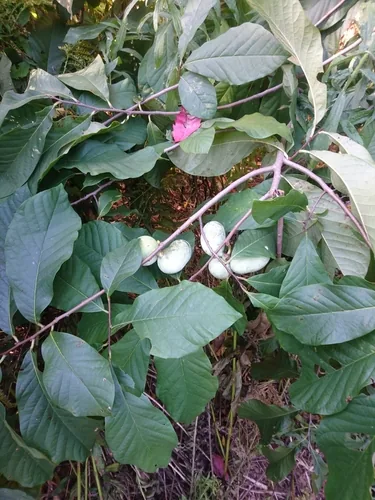
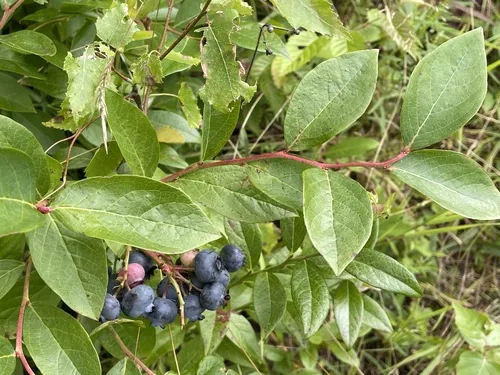
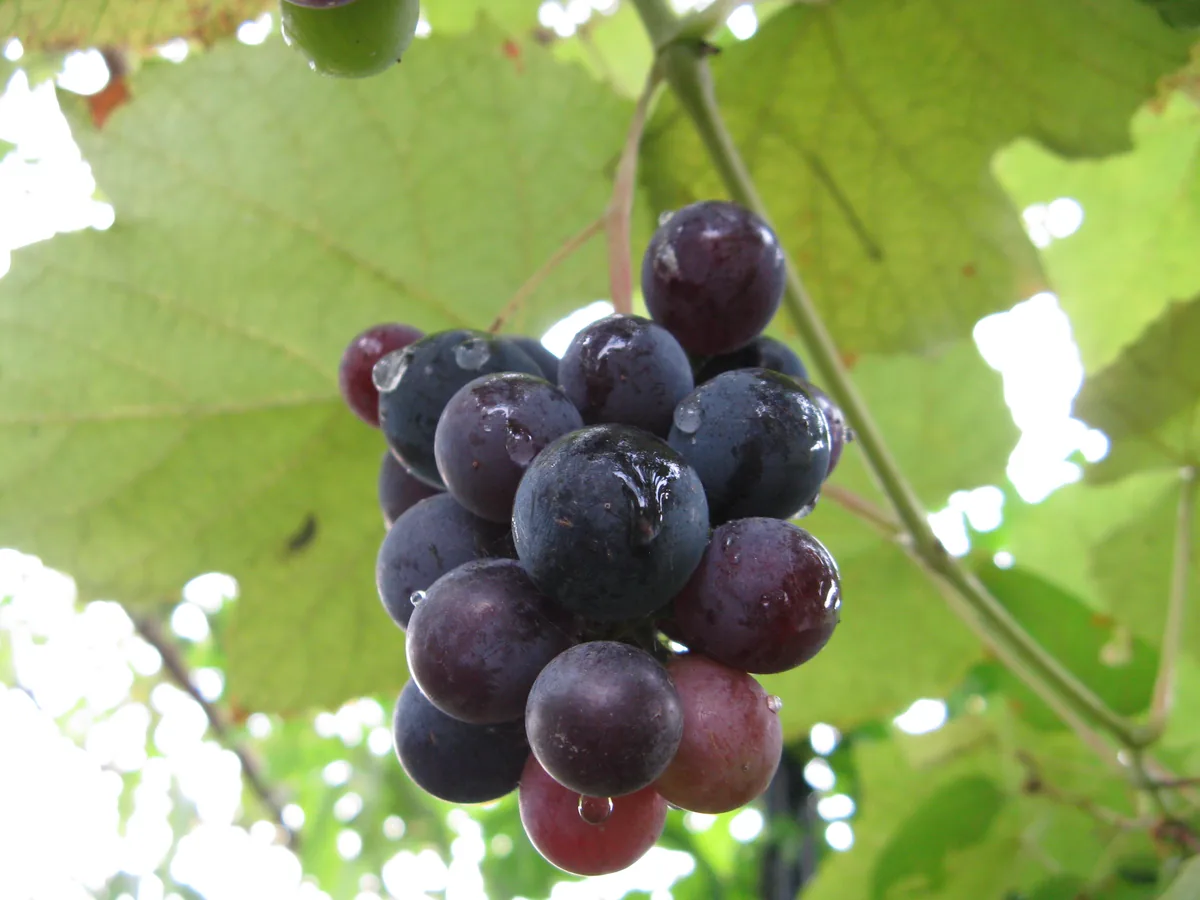
Native Plants of the Lake Erie Shore (Ohio North Coast)
Plants the USDA PLANTS Database documents as native and present in this region’s state, kept only where the published hardiness range meets the Lake Erie Shore (Ohio North Coast)’s USDA zones 6b-7a — closest range match first. Presence is recorded by state, so a plant can be documented across the state and still be scarce in your corner of the region.
The ground across the Lake Erie Shore (Ohio North Coast)
The USDA soil survey maps this ground county by county. These are those records weighted by land area across seven member counties — this region’s own profile, not a state figure.
The ground is predominantly Alfisols, at 56% of mapped acres, followed by Inceptisols (28%), Entisols (10%) and Mollisols (6%). Six soil orders appear somewhere inside the footprint, which is the honest reason a regional soil answer only goes so far. The most extensive named soils are Mahoning, Mill, and Toledo.
41% of those acres are somewhat poorly drained, and another 16% very poorly drained, 14% poorly drained. Topsoil pH runs 5.0–6.5 between the lowest and the highest county on record. 6% of the footprint is classed prime farmland.
Soil order
Alfisols
Drainage
Somewhat poorly drained
Topsoil pH
5.0–6.5
Hydric soils
33%
Soil changes across a driveway, so which of these your own ground sits on is a parcel question rather than a regional one. Ottawa County holds the most wetland ground here, at 66% — soil types explained.
USDA NRCS SSURGO via Soil Data Access

What this means for growing in the Lake Erie Shore (Ohio North Coast)
The soil survey reads this ground county by county, and the readings above are those records summed across the Lake Erie Shore (Ohio North Coast). Here is what they mean for a garden here — and the move an experienced grower makes about each one.
Drainage
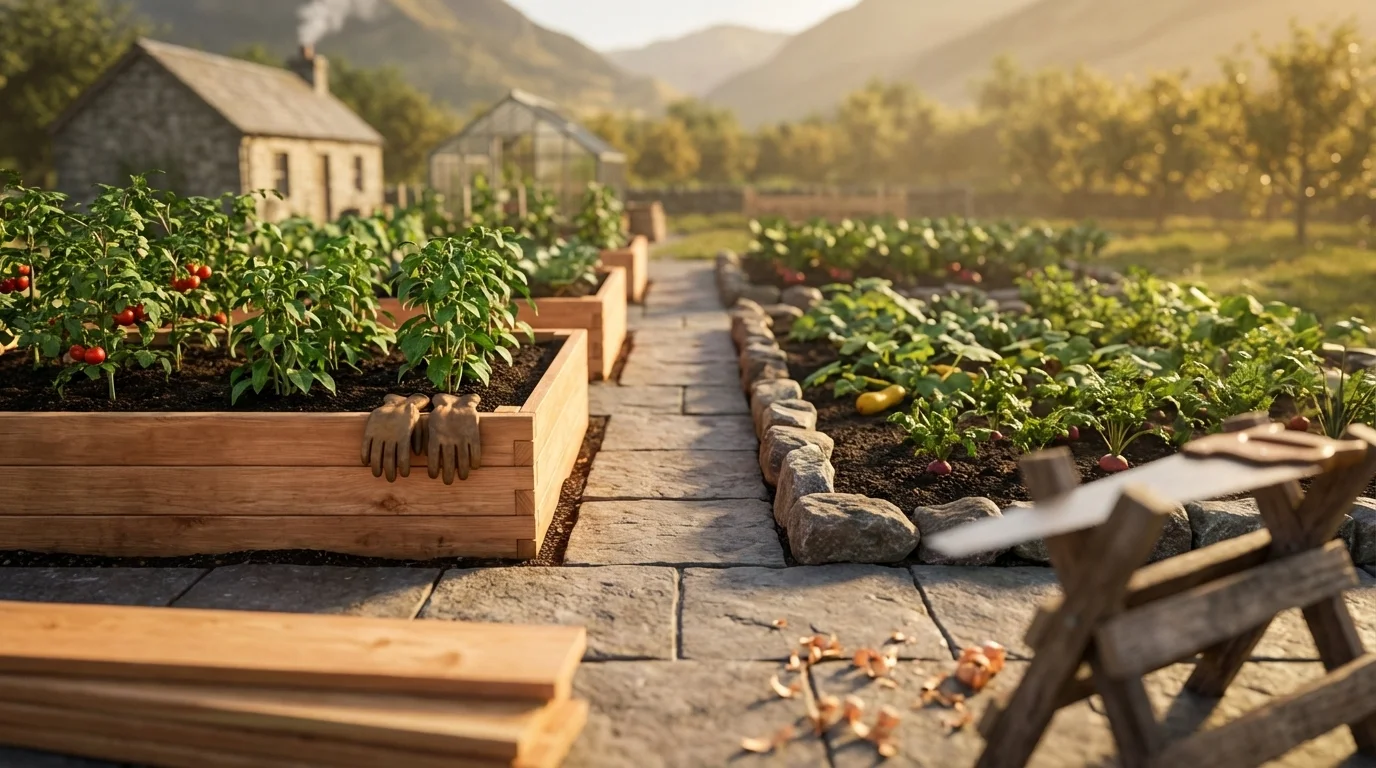
From county records41% of the mapped acres across the Lake Erie Shore (Ohio North Coast) are somewhat poorly drained — ground that sheds water slowly. That is area-weighted across all seven of its mapped counties.
Beds can stay saturated for days after heavy rain, and the roots of most vegetables, berries, and fruit trees suffocate or rot in soil that never drains.
Raised beds or mounded rows lift roots above the wet zone; choose water-tolerant crops for the lowest spots.
USDA NRCS SSURGO
Surface pH
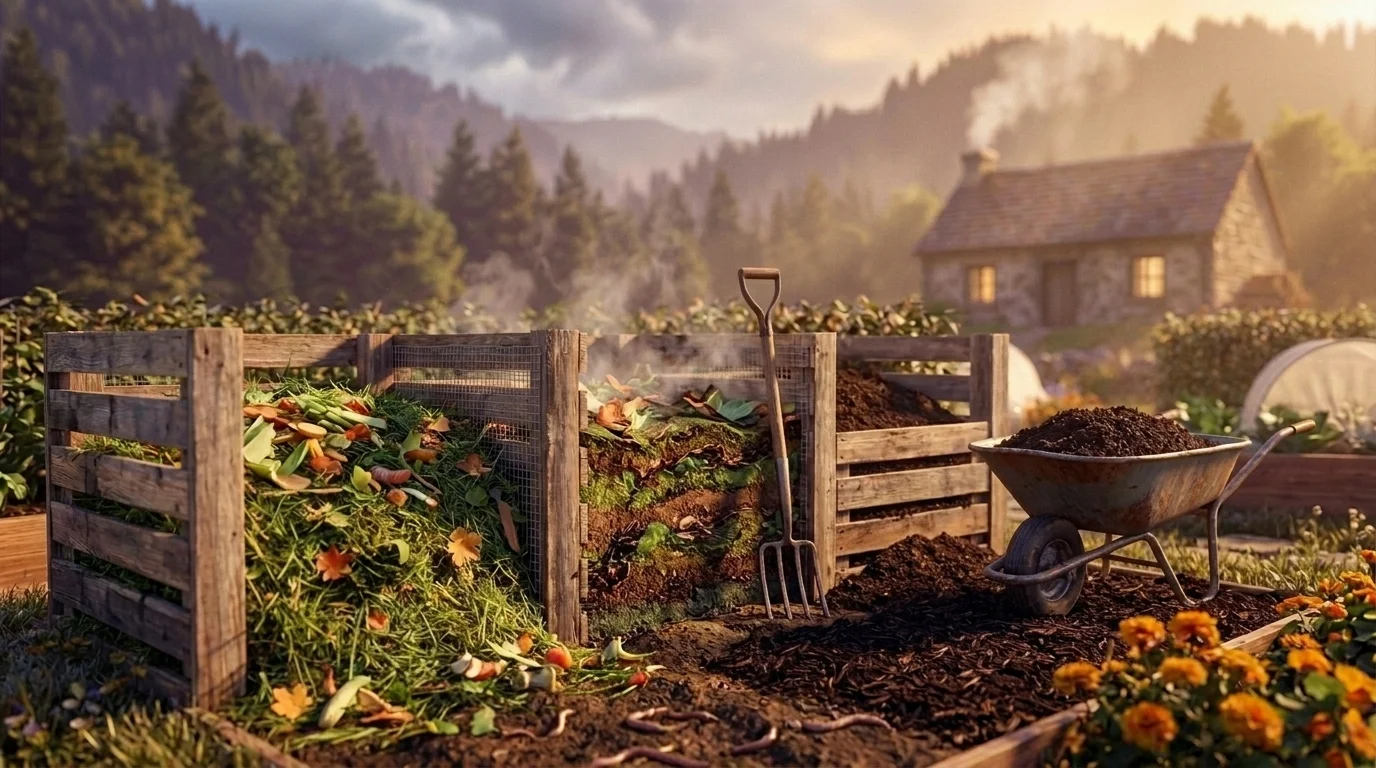
From county recordsTopsoil across the Lake Erie Shore (Ohio North Coast) runs pH 5.0–6.5 — near neutral in four of its seven counties.
This is the range most vegetables prefer — one correction you probably do not have to make, which is genuinely good news for a new bed.
Keep it there with compost rather than lime or sulfur, and only amend if your own soil test says otherwise.
USDA NRCS SSURGO
 Safe to Grow Here?
What the federal record shows across the Lake Erie Shore (Ohio North Coast) — and how to grow with it.
Across the Lake Erie Shore (Ohio North Coast)'s 7 counties the federal record holds 10,793 documented sites, mostly Underground Storage Tanks (5,413), Brownfields (4,011) and Toxics Release Inventory (1,019). The heaviest single county is Cuyahoga County, with 5,284.
That is a regional count, not a reading of any one lot — proximity to a documented site is information, not a diagnosis. Open the map outlined to the Lake Erie Shore (Ohio North Coast) to see which records sit where you actually grow.
Sources Checked
Summed across the 7 counties in the Lake Erie Shore (Ohio North Coast)
A note from Gnorman
What an experienced grower watches for around here
In and around the Lake Erie Shore (Ohio North Coast), two things run higher than the national average across the 7 counties in the Lake Erie Shore (Ohio North Coast) — Toxics Release Inventory (1,019 sites) and Superfund (176 sites). That's not a problem with your land — it's information about it.
Toxics Release Inventory: TRI facilities report annual chemical releases to air, water, and land.
Superfund: Superfund sites represent the most severe contamination in the federal system.
Check prevailing wind direction — downwind parcels face higher exposure than upwind or crosswind locations.
Commission professional soil testing before any food production (test for heavy metals, VOCs, and SVOCs).
Sources: EPA, USGS — 1.8M documented sites tracked nationwide across 8 federal source types.
Your land is one point inside the Lake Erie Shore (Ohio North Coast)
Everything above resolves to the Lake Erie Shore (Ohio North Coast) as a whole — a footprint spanning USDA zones 6b-7a. Your parcel sits in exactly one of them. Slope, tree cover, a low spot that pools cold air, and what is in the soil are all resolved at the address, and none of them are visible at region scale. That is the honest boundary of this page, and the reason the next step is a reading of your own ground rather than a better regional average.
Your Lot vs the Lake Erie Shore (Ohio North Coast) Average
Lake Erie Shore (Ohio North Coast) Average
- ●USDA Zones 6b-7a, averaged across Lake Erie Shore (Ohio North Coast)
- ●One soil character for all of Lake Erie Shore (Ohio North Coast)
- ●State-average frost dates
YOUR Parcel
- ✓Your exact zone, not Lake Erie Shore (Ohio North Coast)'s 6b-7a
- ✓Your SSURGO soil type & pH
- ✓Your sun exposure, cast in 3D
See MY Growing Report
Read your parcel in the Lake Erie Shore (Ohio North Coast)
Pull a site-specific report for your exact address in the Lake Erie Shore (Ohio North Coast) — soil, sun, drainage, frost risk, contamination, and scored plant recommendations.
Three things about your lot that Lake Erie Shore (Ohio North Coast) averages can't show:
We read public map data around The Lake Erie Shore (Ohio North Coast) — soil, climate, flood, and parcel records. How we handle your address.
25+ data sources read at your address, not the Lake Erie Shore (Ohio North Coast) average
How we know this about the Lake Erie Shore (Ohio North Coast)
The boundary: a cluster of neighboring counties. Growing regions have no official boundary, so this footprint is our published one, and every figure on this page was measured over the counties inside it rather than borrowed from the state around it.
The datasets: hardiness from the USDA ARS Plant Hardiness Zone Map 2023, aggregated across the footprint; the growing season from NOAA Regional Climate Centers ACIS 1991–2020 28°F normals, read at each member’s own record; boundaries from US Census TIGER/Line 2025; the contamination record from the federal sources named in that beat above; the soil from the USDA NRCS SSURGO survey, read at each member county’s own record and weighted to this footprint by land area. Where a member carries no record of its own, it is absent from the figure rather than filled in.
Common questions about the Lake Erie Shore (Ohio North Coast)
What hardiness zone is the Lake Erie Shore (Ohio North Coast)?
The Lake Erie Shore (Ohio North Coast) spans USDA hardiness zones 6b-7a, aggregated from the USDA Agricultural Research Service Plant Hardiness Zone Map 2023 across the region's counties. Zones reflect average annual extreme minimum temperatures from 1991–2020 data.
How long is the growing season in the Lake Erie Shore (Ohio North Coast)?
Measured between 28°F hard freezes, the Lake Erie Shore (Ohio North Coast)'s counties mostly run 231 to 236 frost-free days, median 233 (NOAA Regional Climate Centers ACIS, 1991–2020, over 7 member counties). That 5-day spread is the honest read — no single season describes 7 counties, and each county guide below carries its own.
When does frost risk end in the Lake Erie Shore (Ohio North Coast)?
Across the Lake Erie Shore (Ohio North Coast), the middle half of member counties see their last 28°F hard freeze between Mar 31 and Apr 3 (median Apr 1), and their first fall freeze between Nov 18 and Nov 24. Those are hard freezes, not the last light frost: tender transplants wait for about Apr 22, and elevation decides which end of a 3-day spread you garden in.
What grows well in the Lake Erie Shore (Ohio North Coast)?
The Lake Erie Shore (Ohio North Coast)'s conditions suit plants such as Tomato, Sweet Corn, Zucchini, Apple, Pawpaw, Blueberry. What actually thrives on any one site still turns on its specific soil, sun, and drainage — we score each plant against the real conditions at your address.
How is the Lake Erie Shore (Ohio North Coast) defined?
The Lake Erie Shore (Ohio North Coast) is defined here as a curated cluster of 7 neighboring counties that share a growing character. Growing regions have no official boundary, so this footprint is our published one — every county in it is named on this page.
Which states does the Lake Erie Shore (Ohio North Coast) cover?
The Lake Erie Shore (Ohio North Coast) spans Ohio. Each state's full growing guide is linked on this page.
What other growing regions cover the same states?
Appalachia, Ohio River Valley, and Northeast Ohio Snow Belt (Erie Drift Plain Uplands) share at least one state with the Lake Erie Shore (Ohio North Coast). Growing regions overlap and interlock — a single address can sit inside more than one, which is why the precise read is always the parcel, not the region.
What this page reads at the Lake Erie Shore (Ohio North Coast)’s own scale
6 of the readings below were taken at the Lake Erie Shore (Ohio North Coast)'s own scale — the zone 6b-7a band across its footprint, a median 233-day season across its 7 counties and 10,793 documented federal contamination records across its 7 counties, 5,284 of them in Cuyahoga County alone; one is borrowed from a wider read, named and linked below.
Measured here
- The USDA hardiness band 6b-7a aggregated across all 7 counties in the footprintUSDA PHZM 2023
- The boundary itself — the 7 counties this region is curated fromGrowable Ground subregion registry
- The growing character that makes this region distinct from the states it crossesGrowable Ground subregion registry
- The 28°F season across the footprint — the middle half of its 7 counties run 231 to 236 frost-free days, median 233NOAA Regional Climate Centers ACIS, 1991-2020
- The federal contamination record over the whole footprint — 10,793 documented federal contamination records across its 7 counties, 5,284 of them in Cuyahoga County aloneEPA, USGS and USDA federal site records
- The soil order mix across the footprint — 56% Alfisols, topsoil pH 5.0–6.5, area-weighted across its 7 mapped countiesUSDA NRCS SSURGO
Inherited from a wider read
- The candidate plant list — its state's curated sets, merged and filtered to zones 6b-7afrom Ohio
What this page can’t tell you
- Which end of the 5-day range your ground sits at — 231 days at one extreme, 236 at the other, decided mostly by elevationfrost dates explained →
- Which of those soils your own ground sits on — the survey maps them county-wide, and they change across a drivewaysoil types explained →
- The soil pH, drainage, sun hours, and frost pockets on one specific lotwhy one lot differs from the next →
Explore the Lake Erie Shore (Ohio North Coast)
State growing guides
Counties in this region
Other growing regions across Ohio
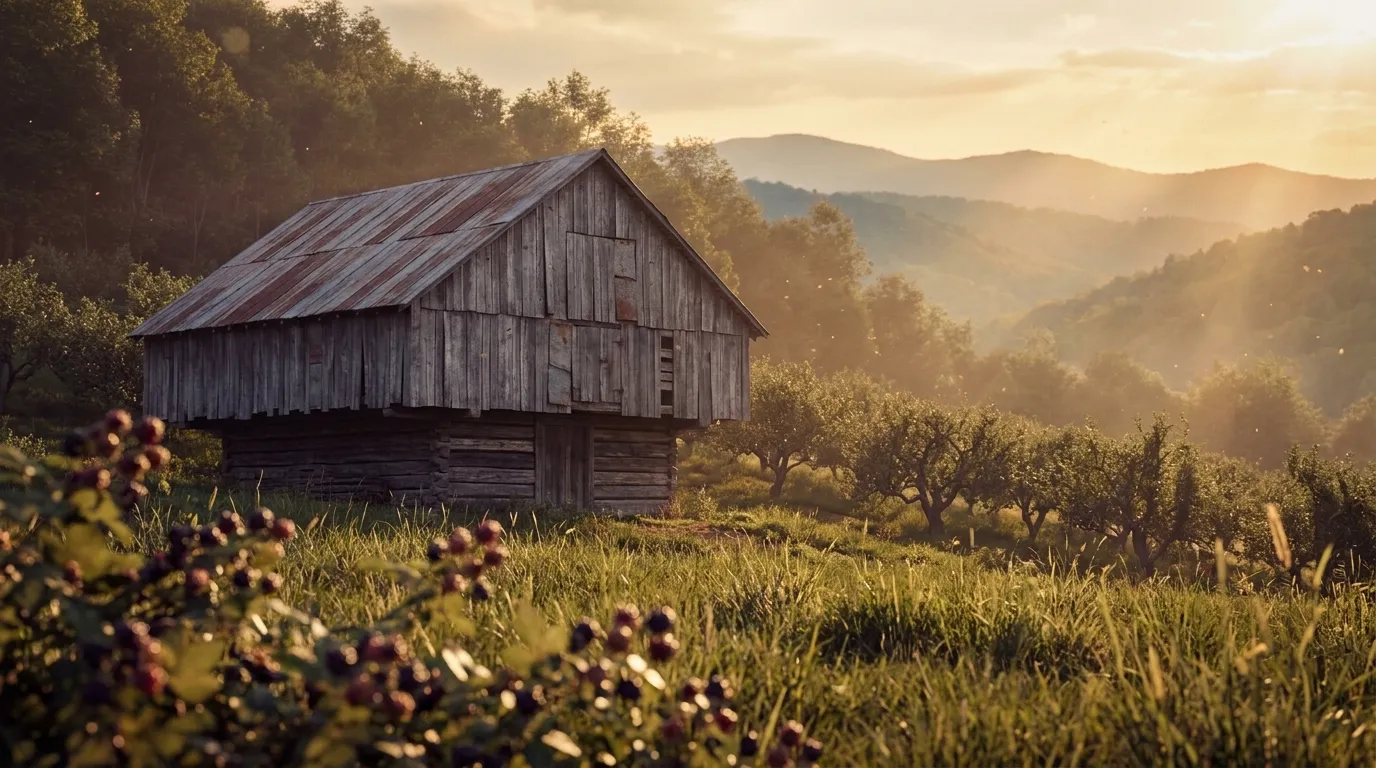
The vast eastern mountain region of steep hollows, thin acidic soils, and short upland seasons — apples, brambles, ramps, and forest crops on hard-won ground. (Union of the core Appalachian ecoregions.)
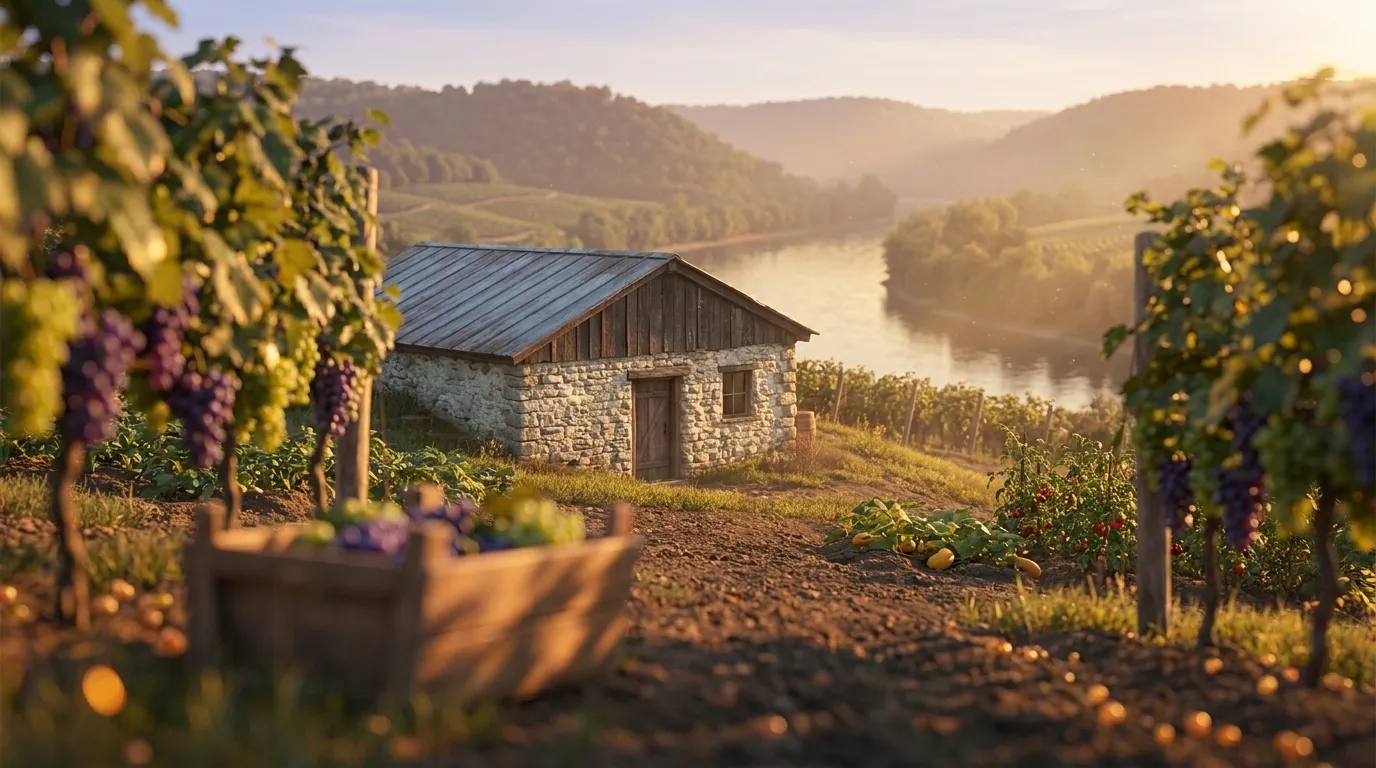
The warm river ribbon threading three states. The Ohio River's moderating flow gives its frontage counties a longer, milder season (zones 6a-7a, ~221 frost-free days) than the colder uplands just inland — a distinct corridor, not the surrounding hill country. It is also historic American wine country: the Ohio River Valley is a federally recognized winegrowing appellation (TTB AVA, 27 CFR §9.78), and its silty bottomland terraces still favor grapes and river-valley vegetables.
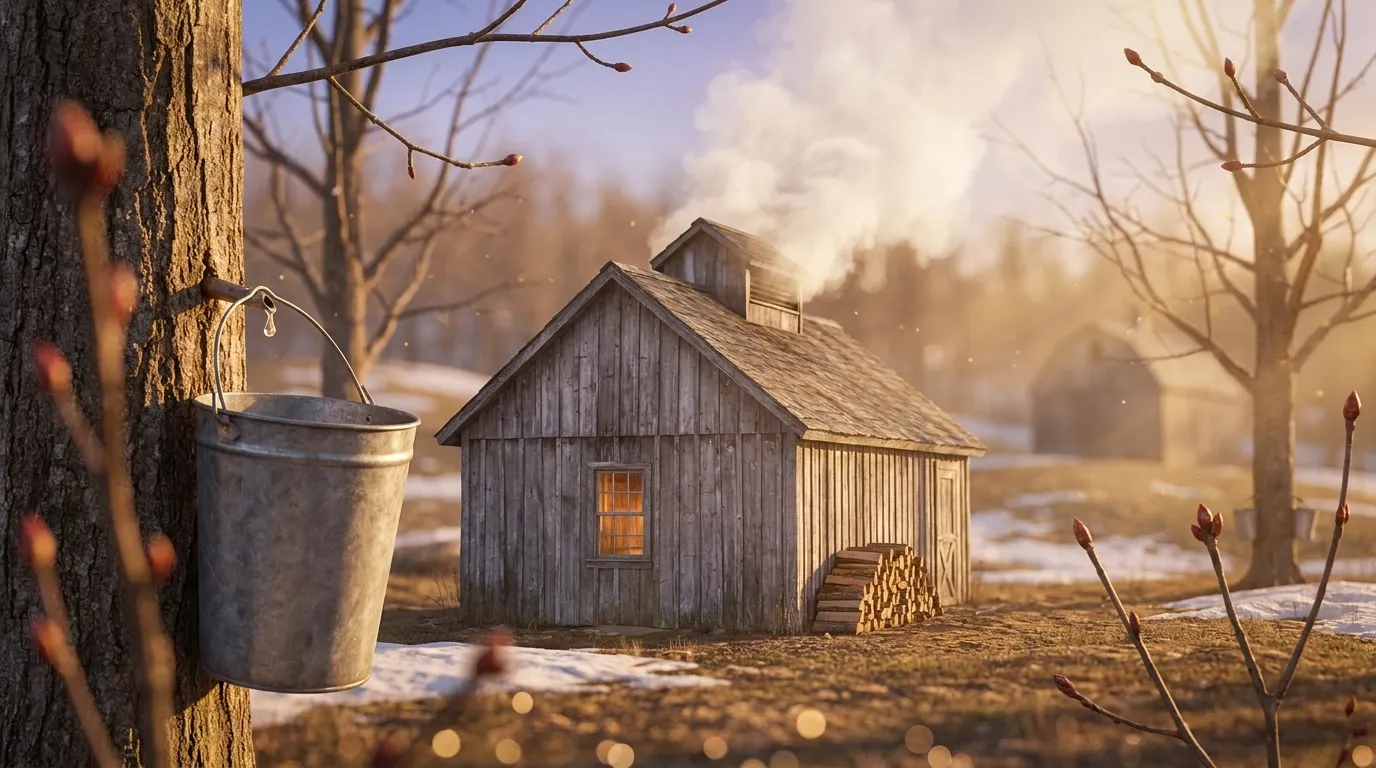
The Erie Drift Plain uplands are the cold shoulder of Ohio's Snow Belt. Geauga, Portage, Medina, Trumbull, and Mahoning all sit at USDA zone 6a with frost-free seasons of roughly 187 to 209 days — a full USDA zone colder and a month-plus shorter than the Lake Erie shore only 20 to 30 miles north, where Ashtabula's shoreline runs 6b and 233 frost-free days. Higher glacial-till elevation and the heaviest lake-effect snow in Ohio give growers here a genuinely late-spring, short-season identity: it is no accident that Geauga is the state's maple-syrup capital and home to one of the world's largest Amish farming settlements.