
The Bayfield Peninsula Fruit Belt spans USDA hardiness zones 4b-5a — a range where zone-matched perennials and frost-aware annual timing set what succeeds.
Wisconsin's improbable orchard coast — the Bayfield peninsula's lakeshore reads 4b-5a with measured seasons to 179 days, Superior's deep water holding fall frost off long enough for the apples, pears, and berries the 4a interior cannot carry. These conditions suit potato, cranberry, cherry, and sugar maple — a starting list any specific site will trim or extend with its own soil, sun, and drainage.
The Bayfield Peninsula Fruit Belt spans Wisconsin.
Your yard isn't all of the Bayfield Peninsula Fruit Belt.
The Bayfield Peninsula Fruit Belt spans USDA zones 4b-5a, but your parcel sits in exactly one — and slope, tree cover, and low spots nudge it further. Enter your address and we'll score 1,085 plants against your land's actual soil, sun, and frost.
We read public map data around Bayfield Peninsula Fruit Belt — soil, climate, flood, and parcel records. How we handle your address.
No card required · your parcel report in seconds — read in full free for your first 14 days
The Bayfield Peninsula Fruit Belt — the short answer
The Bayfield Peninsula Fruit Belt: USDA zones 4b-5a, 154–179 frost-free days, in Wisconsin.
- USDA zones
- 4b-5a
- USDA PHZM 2023, aggregated over the footprint
- Frost-free season
- 154–179 days
- NOAA Regional Climate Centers ACIS, 1991-2020
- Towns
- 6
- US Census TIGER/Line 2025
- Region type
- Town cluster
- Growable Ground growing-region registry
Region boundary: Growable Ground growing-region registry — curated county clusters, EPA Level III ecoregions, and town clusters drawn finer than any county. Where a region publishes no measured season, no season figure is shown.
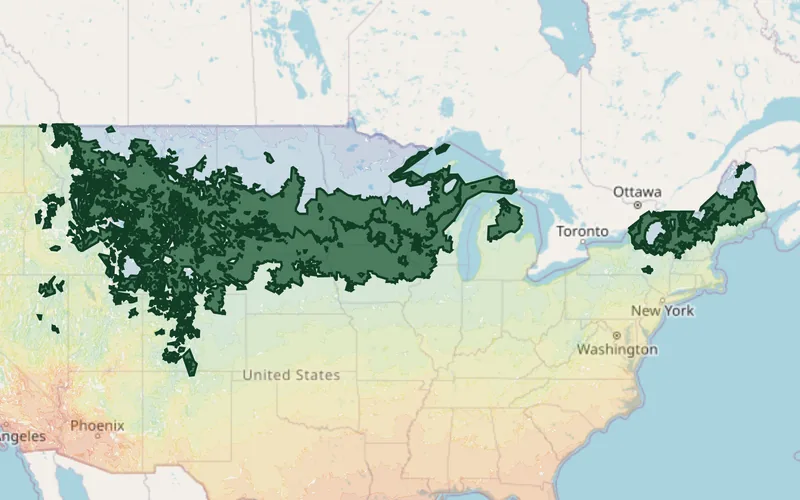
What Grows in the Bayfield Peninsula Fruit Belt
Plants matched to the Bayfield Peninsula Fruit Belt's USDA zones 4b-5a, ordered by how much hardiness margin each has across the region — the ones with room to spare at both ends of this band lead. Each links to its full growing profile.
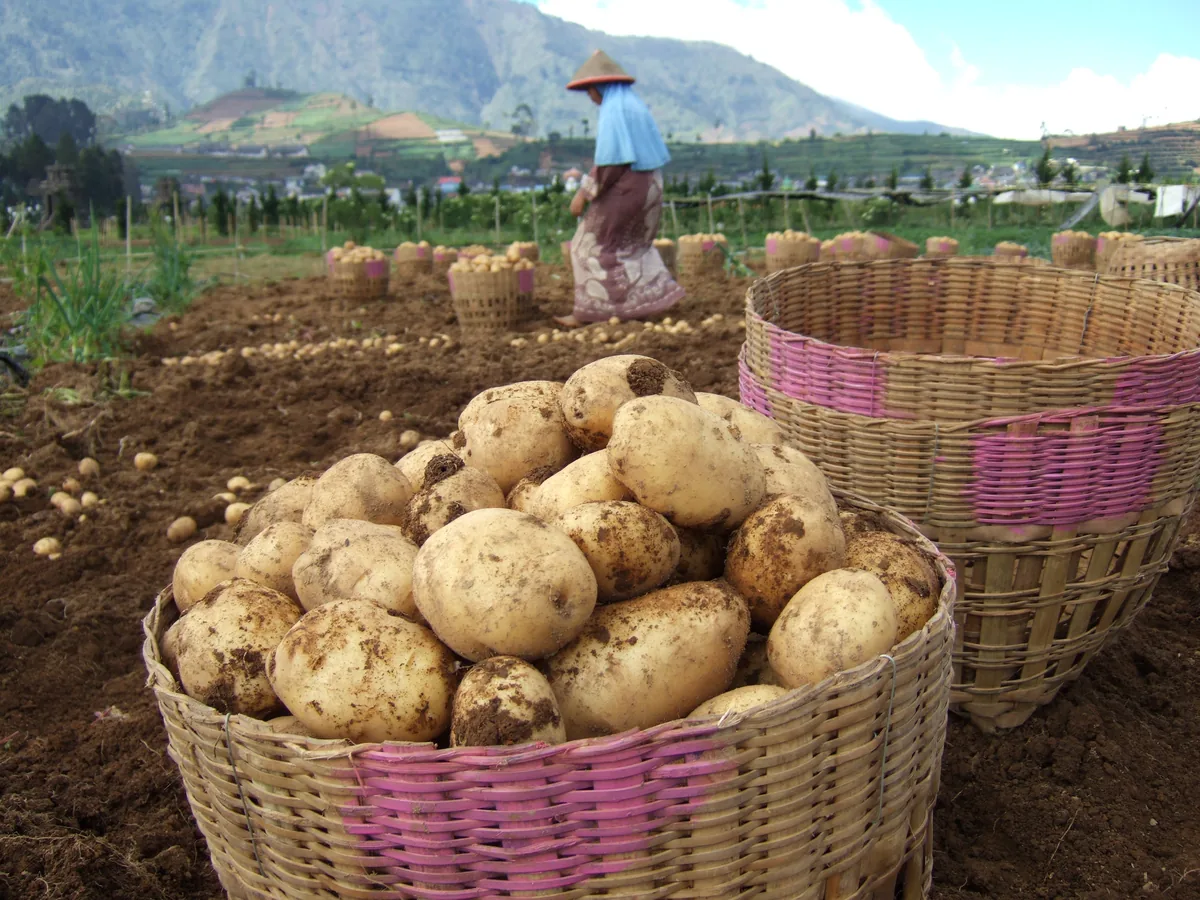
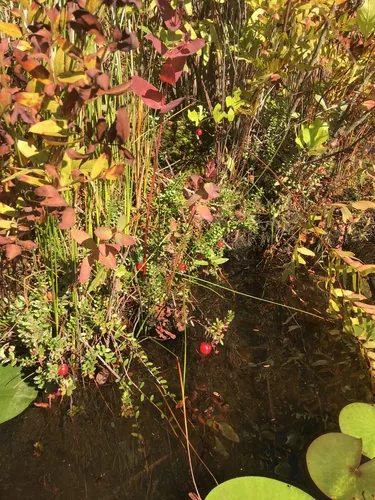
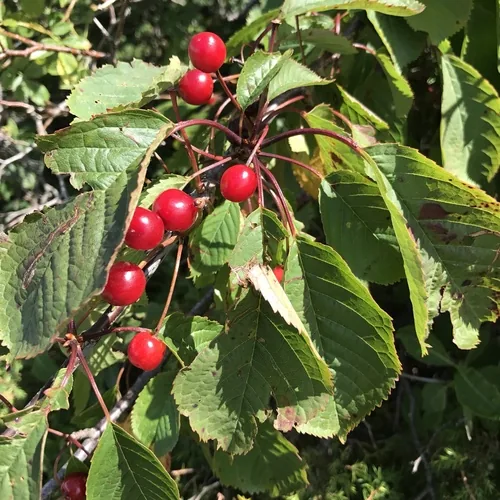
Native Plants of the Bayfield Peninsula Fruit Belt
Plants the USDA PLANTS Database documents as native and present in this region’s state, kept only where the published hardiness range meets the Bayfield Peninsula Fruit Belt’s USDA zones 4b-5a — closest range match first. Presence is recorded by state, so a plant can be documented across the state and still be scarce in your corner of the region.
The ground around the Bayfield Peninsula Fruit Belt
The USDA soil survey maps this ground county by county. These are those records weighted by land area across the two counties containing the Bayfield Peninsula Fruit Belt — the ground the Bayfield Peninsula Fruit Belt sits in, read at the only grain the survey publishes.
In the counties containing the Bayfield Peninsula Fruit Belt, the ground is predominantly Spodosols, at 60% of mapped acres, followed by Alfisols (20%), Histosols (12%) and Entisols (5%). Six soil orders appear in that record, which is the honest reason a regional soil answer only goes so far. The most extensive named soils are Gogebic, Vilas, and Rubicon.
46% of those acres are moderately well drained, and another 15% well drained, 12% excessively drained. Topsoil pH runs 4.8–5.9 between the lowest and the highest county on record. 4% of the footprint is classed prime farmland.
Soil order
Spodosols
Drainage
Moderately well drained
Topsoil pH
4.8–5.9
Hydric soils
17%
Soil changes across a driveway, so which of these your own ground sits on is a parcel question rather than a regional one. Ashland County holds the most wetland ground here, at 27% — soil types explained.
USDA NRCS SSURGO via Soil Data Access

What this means for growing in the Bayfield Peninsula Fruit Belt
The soil survey reads this ground county by county, and the readings above are the record for the counties containing the Bayfield Peninsula Fruit Belt. Here is what they mean for a garden here — and the move an experienced grower makes about each one.
Drainage
From county records46% of the mapped acres across the counties containing the Bayfield Peninsula Fruit Belt are moderately well drained — roughly the middle of the drainage range. The survey maps this ground county-wide, so it describes the setting the Bayfield Peninsula Fruit Belt sits in rather than the valley floor alone.
This is close to the middle most vegetables prefer: it holds enough water to carry a crop between rains without staying waterlogged. The catch is that a wet spring or a low corner can still tip it soggy.
Plant on the site as-is for most crops, but keep the lowest, slowest-draining beds for moisture-tolerant plantings.
USDA NRCS SSURGO
Surface pH
From county recordsTopsoil across the counties containing the Bayfield Peninsula Fruit Belt runs pH 4.8–5.9 — acidic in all two of them.
Blueberries, potatoes, and rhododendrons thrive in it, but most vegetables start locking out nutrients below about pH 6.0 and grow pale and stunted no matter how much you feed them.
A measured lime application raises pH for the crops that need it — but test first, because the right rate depends on your own soil, not the county average.
USDA NRCS SSURGO
Wet ground
From county recordsAbout 17% of the ground across the counties containing the Bayfield Peninsula Fruit Belt is mapped as hydric — wetland — soil. Ashland County carries the most, at 27%.
If your lot falls in one of those pockets, a standard in-ground bed will fight waterlogging all season, and roots that need air will struggle.
Check how your own ground drains before you dig; raised beds or moisture-loving plantings turn a wet corner from a problem into a niche.
USDA NRCS SSURGO
 Safe to Grow Here?
What the federal record shows across the Bayfield Peninsula Fruit Belt — and how to grow with it.
Across the 2 counties containing the Bayfield Peninsula Fruit Belt the federal record holds 869 documented sites, mostly Underground Storage Tanks (403), Nitrate (260) and Brownfields (158). The heaviest single county is Bayfield County, with 485.
That is the containing counties' count — this region is a smaller piece of that ground, so it is context, not a reading of any one lot. Open the map outlined to the Bayfield Peninsula Fruit Belt to see which records sit where you actually grow.
Sources Checked
Summed across the 2 counties containing the Bayfield Peninsula Fruit Belt

A note from Gnorman
What an experienced grower watches for around here
In and around the Bayfield Peninsula Fruit Belt, Nitrate runs higher than the national average — 260 sites across the 2 counties containing the Bayfield Peninsula Fruit Belt. Knowing it is half the work — and it's nothing a thoughtful grower can't plan for.
Nitrate: Nitrate contamination primarily comes from agricultural fertilizer runoff and failing septic systems.
Test well water for nitrate if you rely on a private well for irrigation (EPA standard: 10 mg/L).
Sources: EPA, USGS — 1.8M documented sites tracked nationwide across 8 federal source types.
Your land is one point inside the Bayfield Peninsula Fruit Belt
Everything above resolves to the Bayfield Peninsula Fruit Belt as a whole — a footprint spanning USDA zones 4b-5a. Your parcel sits in exactly one of them. Slope, tree cover, a low spot that pools cold air, and what is in the soil are all resolved at the address, and none of them are visible at region scale. That is the honest boundary of this page, and the reason the next step is a reading of your own ground rather than a better regional average.
Your Lot vs the Bayfield Peninsula Fruit Belt Average
Bayfield Peninsula Fruit Belt Average
- ●USDA Zones 4b-5a, averaged across Bayfield Peninsula Fruit Belt
- ●One soil character for all of Bayfield Peninsula Fruit Belt
- ●State-average frost dates
YOUR Parcel
- ✓Your exact zone, not Bayfield Peninsula Fruit Belt's 4b-5a
- ✓Your SSURGO soil type & pH
- ✓Your sun exposure, cast in 3D
See MY Growing Report
Read your parcel in the Bayfield Peninsula Fruit Belt
Pull a site-specific report for your exact address in the Bayfield Peninsula Fruit Belt — soil, sun, drainage, frost risk, contamination, and scored plant recommendations.
Three things about your lot that Bayfield Peninsula Fruit Belt averages can't show:
We read public map data around The Bayfield Peninsula Fruit Belt — soil, climate, flood, and parcel records. How we handle your address.
25+ data sources read at your address, not the Bayfield Peninsula Fruit Belt average
How we know this about the Bayfield Peninsula Fruit Belt
The boundary: the region's own towns — a footprint finer than any county, because the county average would misread this microclimate. Growing regions have no official boundary, so this footprint is our published one, and every figure on this page was measured over the towns inside it rather than borrowed from the state around it.
The datasets: hardiness from the USDA ARS Plant Hardiness Zone Map 2023, aggregated across the footprint; the growing season from NOAA Regional Climate Centers ACIS 1991–2020 28°F normals, read at each member’s own record; boundaries from US Census TIGER/Line 2025; the contamination record from the federal sources named in that beat above; the soil from the USDA NRCS SSURGO survey, read at each member county’s own record and weighted to this footprint by land area. Where a member carries no record of its own, it is absent from the figure rather than filled in.
Common questions about the Bayfield Peninsula Fruit Belt
What hardiness zone is the Bayfield Peninsula Fruit Belt?
The Bayfield Peninsula Fruit Belt spans USDA hardiness zones 4b-5a, aggregated from the USDA Agricultural Research Service Plant Hardiness Zone Map 2023 across the region's own towns. Zones reflect average annual extreme minimum temperatures from 1991–2020 data.
How long is the growing season in the Bayfield Peninsula Fruit Belt?
Measured between 28°F hard freezes, the Bayfield Peninsula Fruit Belt's towns mostly run 161 to 177 frost-free days, median 171 (NOAA Regional Climate Centers ACIS, 1991–2020, over 6 member towns). That 16-day spread is the honest read — no single season describes 6 towns, and each town guide below carries its own.
When does frost risk end in the Bayfield Peninsula Fruit Belt?
Across the Bayfield Peninsula Fruit Belt, the middle half of member towns see their last 28°F hard freeze between May 1 and May 6 (median May 4), and their first fall freeze between Oct 15 and Oct 25. Those are hard freezes, not the last light frost: tender transplants wait for about May 25, and elevation decides which end of a 5-day spread you garden in.
What grows well in the Bayfield Peninsula Fruit Belt?
The Bayfield Peninsula Fruit Belt's conditions suit plants such as Potato, Cranberry, Cherry, Sugar Maple, Ginseng. What actually thrives on any one site still turns on its specific soil, sun, and drainage — we score each plant against the real conditions at your address.
How is the Bayfield Peninsula Fruit Belt defined?
The Bayfield Peninsula Fruit Belt is a true microclimate — smaller than the counties that contain it, with a growing reality of its own. So this page is built from the region's own 6 towns, each carrying its own hardiness zone and frost record, rather than from a county average measured somewhere else.
Which states does the Bayfield Peninsula Fruit Belt cover?
The Bayfield Peninsula Fruit Belt spans Wisconsin. Each state's full growing guide is linked on this page.
What other growing regions cover the same states?
Driftless Area, Northwoods (Northern Wisconsin), Southeastern Wisconsin Lakeshore (Milwaukee Metro), Central Sands (Central Wisconsin), and Door County share at least one state with the Bayfield Peninsula Fruit Belt. Growing regions overlap and interlock — a single address can sit inside more than one, which is why the precise read is always the parcel, not the region.
What this page reads at the Bayfield Peninsula Fruit Belt’s own scale
6 of the readings below were taken at the Bayfield Peninsula Fruit Belt's own scale — the zone 4b-5a band across its footprint, a median 171-day season across its 6 towns and 869 documented federal contamination records across its 2 counties, 485 of them in Bayfield County alone; one is borrowed from a wider read, named and linked below.
Measured here
- The USDA hardiness band 4b-5a aggregated across all 6 towns in the footprintUSDA PHZM 2023
- The boundary itself — the 6 towns this region is curated fromGrowable Ground subregion registry
- The growing character that makes this region distinct from the states it crossesGrowable Ground subregion registry
- The 28°F season across the footprint — the middle half of its 6 towns run 161 to 177 frost-free days, median 171NOAA Regional Climate Centers ACIS, 1991-2020
- The federal contamination record over the whole footprint — 869 documented federal contamination records across its 2 counties, 485 of them in Bayfield County aloneEPA, USGS and USDA federal site records
- The soil order mix across the footprint — 60% Spodosols, topsoil pH 4.8–5.9, area-weighted across its 2 mapped countiesUSDA NRCS SSURGO
Inherited from a wider read
- The candidate plant list — its state's curated sets, merged and filtered to zones 4b-5afrom Wisconsin
What this page can’t tell you
- Which end of the 16-day range your ground sits at — 161 days at one extreme, 177 at the other, decided mostly by elevationfrost dates explained →
- Which of those soils your own ground sits on — the survey maps them county-wide, and they change across a drivewaysoil types explained →
- The soil pH, drainage, sun hours, and frost pockets on one specific lotwhy one lot differs from the next →
Explore the Bayfield Peninsula Fruit Belt
State growing guides
Towns in this region
Counties containing this region
Other growing regions across Wisconsin
An unglaciated landscape of steep ridges, deep valleys, and spring-fed coulees in the Upper Midwest — a stronghold of diversified small farms and cold-hardy fruit.
Wisconsin's coldest, shortest-season tier: the interior forest counties sit at hardiness zones 4a-4b with only 140-158 frost-free days (Florence 140, Sawyer 142, Vilas 143) — roughly two months shorter than the Milwaukee lakeshore. On glaciated northern soils where winter lows reach the -30F floor of zone 4a, Northwoods growers can't inherit the state page's averaged planting dates, variety lists, or perennial ratings — the short interior season sets a different rulebook than the driftless coulees or the lake-warmed Door peninsula to the south.
Wisconsin's warmest, longest-season corner — and its only zone 6a. Lake Michigan's thermal mass holds the immediate Milwaukee–Racine shore at USDA zone 6a with 216–217 frost-free days (USDA PHZM 2023 + county climate normals), roughly two extra months over the state's northern zone-4 country. The lake buffers spring and fall alike, so a metro or suburban grower here can run warm-season varieties and a planting calendar the statewide "short-season Wisconsin" page never delivers — grading honestly from 6a on the shore to 5b (188–210 frost-free days) across the inland metro and up the Sheboygan–Manitowoc coast. Distinct from Door County's cherry peninsula further north on the same shore.
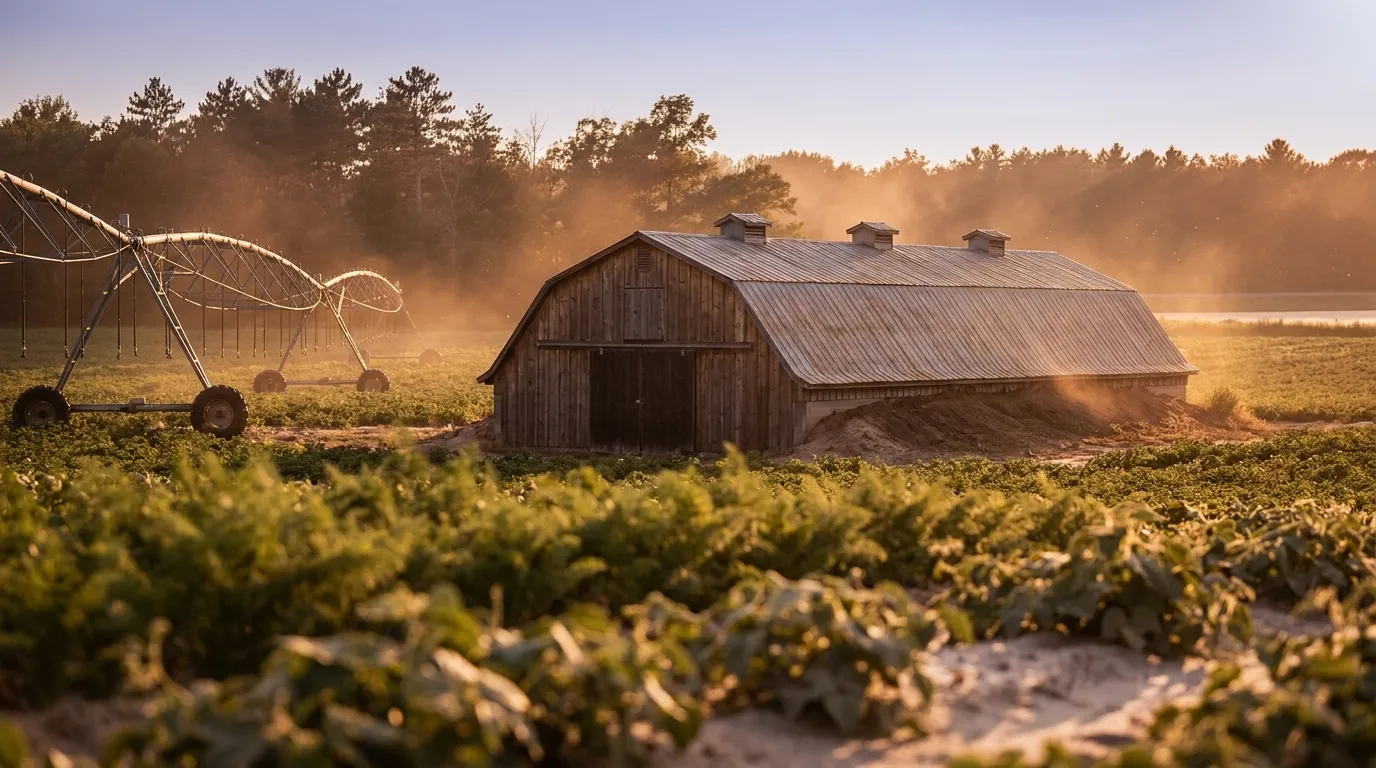
Central Wisconsin's growing challenge isn't the cold — it's the sand. This is glacial-outwash country: the droughty, fast-draining, low-fertility sand plain left by Glacial Lake Wisconsin, which is why it became the state's irrigated vegetable belt (potatoes, snap beans, sweet corn) and the heart of the nation's #1 cranberry region around Wood and Juneau. At USDA zone 4b–5a your calendar reads mid-range, but the ground behaves nothing like Wisconsin's silt- and clay-loam average — water and nutrients move straight through, so irrigation and organic-matter building matter more here than the frost date. Towns on the sands: Wisconsin Rapids, Stevens Point, Plover, Bancroft.
A Lake Michigan and Green Bay peninsula whose water-moderated climate holds a roughly 201-day frost-free season in USDA zone 5b — about two and a half weeks longer than inland Brown County just to the south.