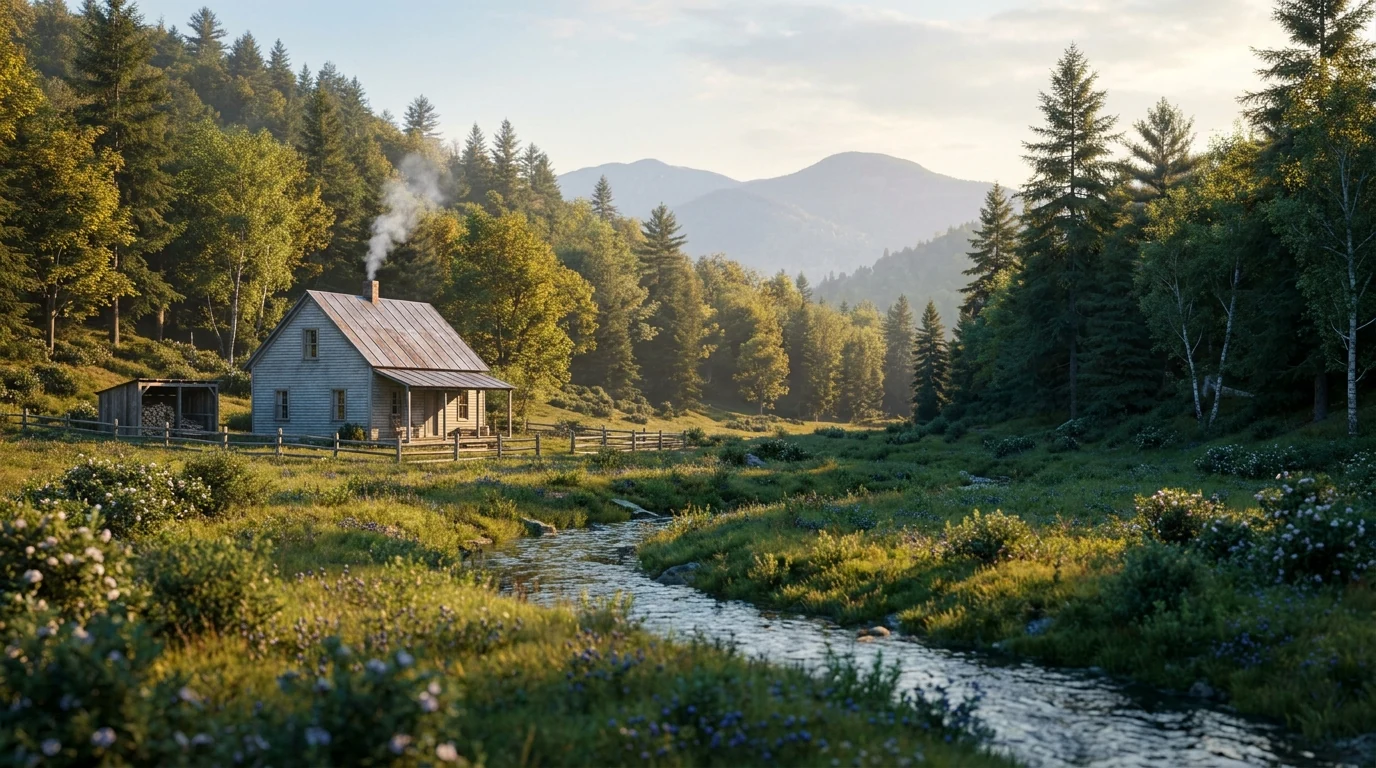
Powell County, in Montana, sits in USDA hardiness zone 4b — a zone band wide enough that plant choice, not possibility, is the interesting question.
The conditions favor okra, cranberry, cilantro, and zucchini, among others — though every individual site edits that list with its own soil, sun, and drainage.
Grounded in USDA PHZM 2023 · Growable Ground suitability scoring · NOAA 1991–2020 Climate Normals
Powell County holds more than one microclimate.
Soils and elevations shift across Powell County, so your frost dates and drainage aren't the county average. Enter your address and we'll score 1,085 plants against your land's actual soil, sun, and frost.
We read public map data around Powell County — soil, climate, flood, and parcel records. How we handle your address.
No card required · your parcel report in seconds — read in full free for your first 14 days
Powell County — the short answer
Powell County, Montana: USDA zone 4b, about 116 days between hard freezes, across 1.5M acres.
- USDA zone
- 4b
- USDA PHZM 2023
- Last hard freeze (28°F)
- May 19
- NOAA RCC-ACIS 1991–2020 daily record, 28°F
- First hard freeze (28°F)
- Sep 12
- NOAA RCC-ACIS 1991–2020 daily record, 28°F
- Days between freezes
- ~116
- NOAA RCC-ACIS 1991–2020 daily record, 28°F
- County area
- 1.5M acres
- US Census TIGER/Line 2025
Every figure names the dataset it came from. Hard-freeze dates are county 28°F normals: light frosts run a few weeks past them, and tender transplants usually wait 2–3 weeks after the last hard freeze.
Hardiness Zone Range
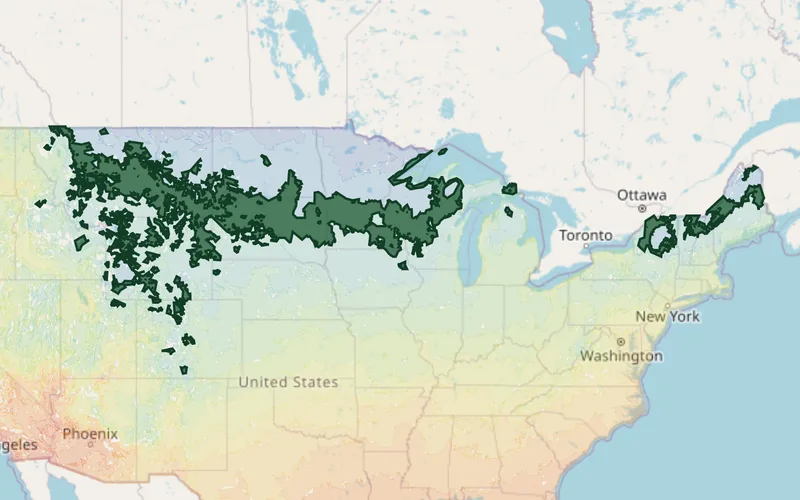
Zone 4b is Powell County's average, not your lot's — a low corner or a tree line moves it. Against Powell County's 116-day season, see what your own ground reads.
Heat in Powell County
Across a year, Powell County accumulates about 981 growing degree days above 50°F, about 689 fewer than the middle Montana county — ahead of 14 of Montana’s 56 counties. Degree days are the heat a crop actually gets to work with — more of them is more room to ripen a long-season crop before the freeze closes the window.
Grounded in PRISM Climate Group, Oregon State University — 1991–2020 monthly normals
Soil in Powell County
Across Powell County, the ground is predominantly Inceptisols, where Danvers, Yreka, and Bignell are the most extensive named soil series. The soil is generally well drained with a gravelly loam surface. Topsoil pH runs about 5.9–7.0, slightly acidic. Rainfall drains through hydrologic group C soils.
Soil order
Inceptisols
Drainage
Well drained
Prime farmland
1%
Hydric soils
3%
Soil still varies lot by lot — soil types explained.
How the ground varies across Powell County
The USDA soil survey maps 63% of Powell County as well drained — but another 21% drains differently: 15% somewhat excessively drained, 2% poorly drained.
Danvers is the most extensive named soil at 4% of mapped acres, then Yreka (3%) and Bignell (3%).
Which of them your own lot sits on is a parcel question, not a county one. Check your address for the survey at your boundary.
What this means for growing in Powell County
Each reading below is measured for Powell County itself — here is what it means for a garden here, and the move an experienced grower makes about it.
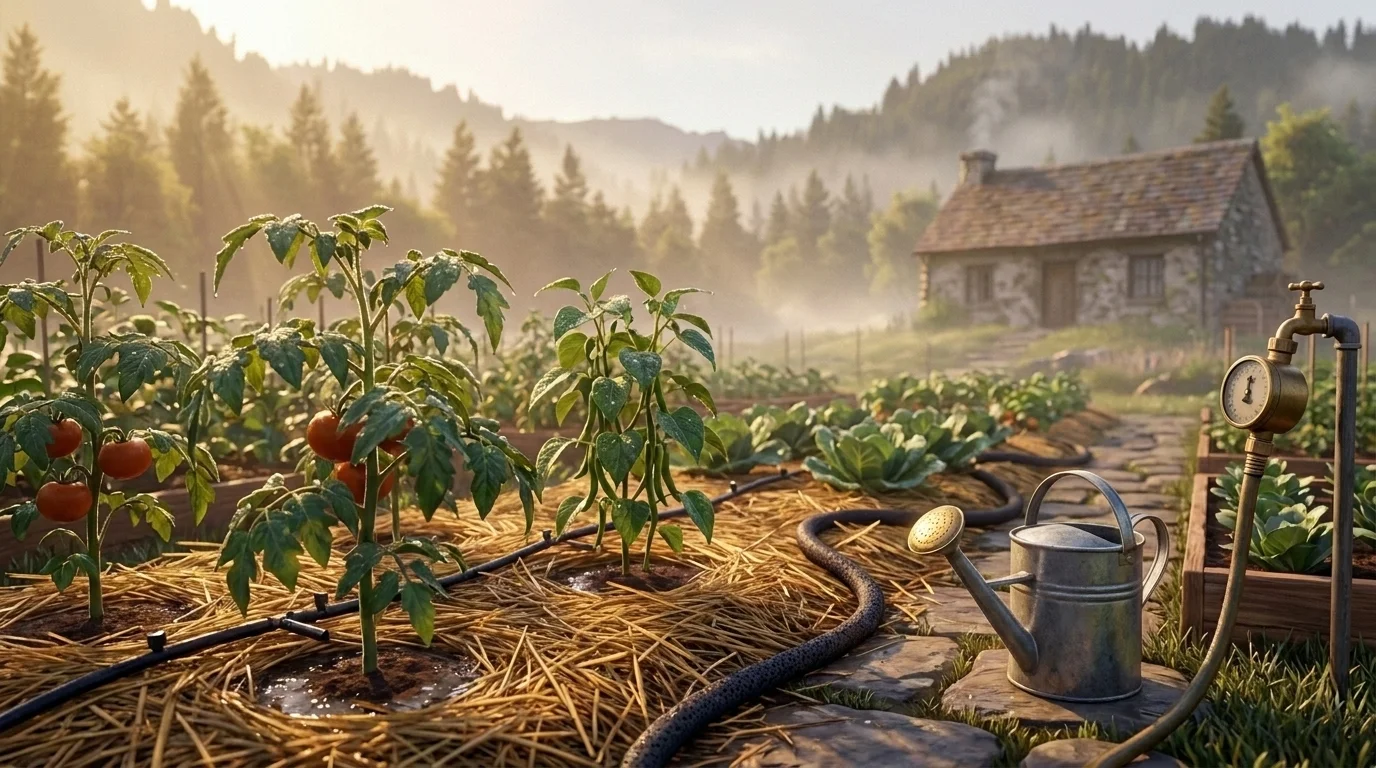
Drainage
MeasuredThe dominant soils across Powell County are well drained, in hydrologic group C — ground that drains quickly.
The upside is soil you can work early in spring and roots that never drown; the cost is that fast-draining ground dries out fast and leaches nutrients away before plants can use them.
Work in compost and mulch to hold moisture and feed, and water more often in short doses than deep and rarely.
USDA NRCS SSURGO

Surface pH
MeasuredTopsoil across Powell County runs about pH 5.9–7.0, close to neutral.
This is the range most vegetables prefer — one correction you probably do not have to make, which is genuinely good news for a new bed.
Keep it there with compost rather than lime or sulfur, and only amend if your own soil test says otherwise.
USDA NRCS SSURGO

Season length
MeasuredPowell County runs about 116 days between hard freezes — a short growing season.
Long-maturing crops like melons, sweet potatoes, and winter squash can run out of runway before the first hard freeze, ripening late or not at all.
Lead with fast-maturing varieties, and stretch the season on both ends with cold frames, low tunnels, or a greenhouse.
NOAA 1991–2020 Climate Normals
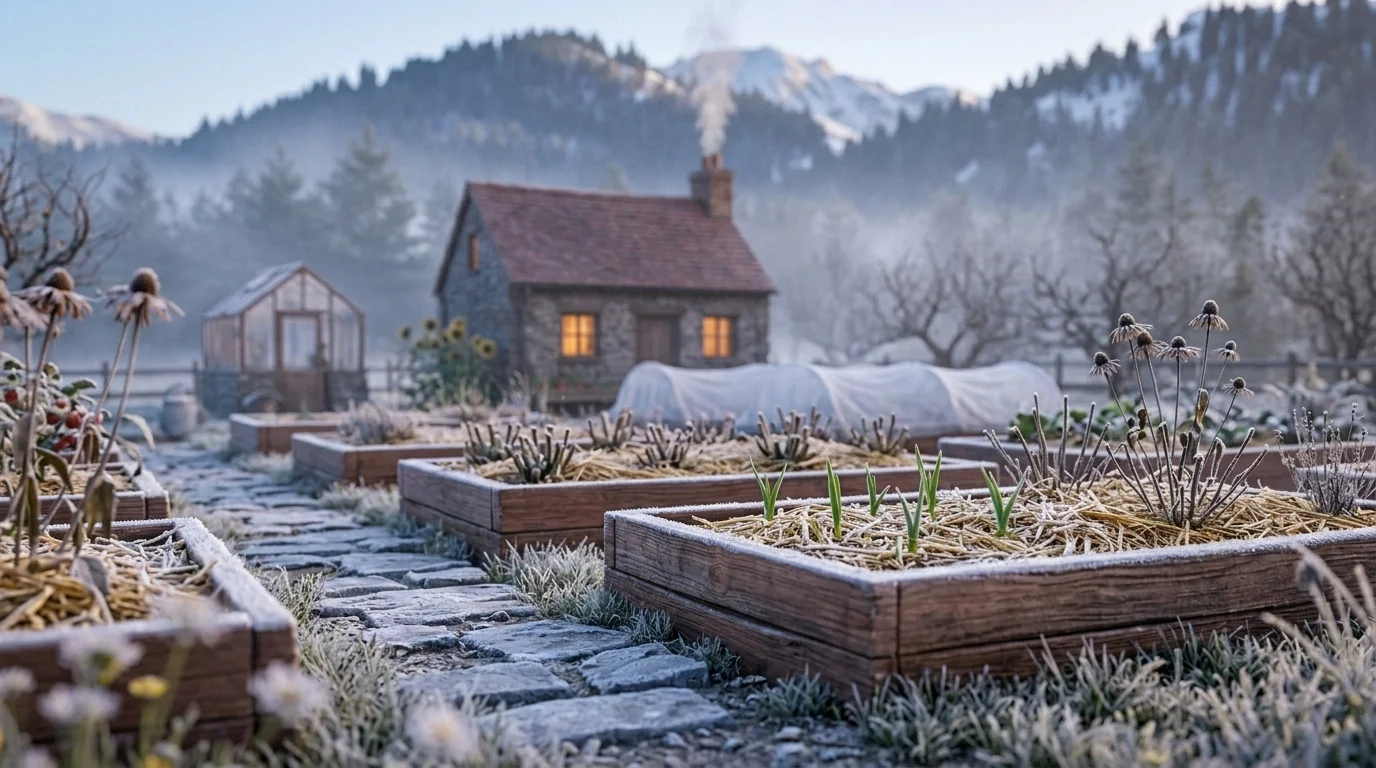
Winter hardiness
MeasuredPowell County sits in USDA hardiness zone 4b.
The zone sets which perennials, shrubs, and fruit trees live through an average winter here — a plant rated for a colder zone is a safe bet, one rated warmer needs winter protection or gets treated as an annual.
Match perennials and fruit to the zone before you buy, so nothing you plant is a gamble against the cold.
USDA PHZM 2023
The kind of country Powell County is in
Powell County spans 2 EPA Level III ecoregions — Middle Rockies (82%) and Canadian Rockies (18%). Which one your land falls in changes what grows wild there and how the ground behaves, and a county-wide answer cannot tell you which.
What Grows in Powell County
We scored all 1,085 plants against Powell County's own USDA zone 4b and its own 116-day season between hard freezes, using the same matching engine that runs a full parcel report. These cleared both. Sun, soil pH and drainage vary lot by lot — those are the parcel questions below. Each card opens that plant's Montana profile.
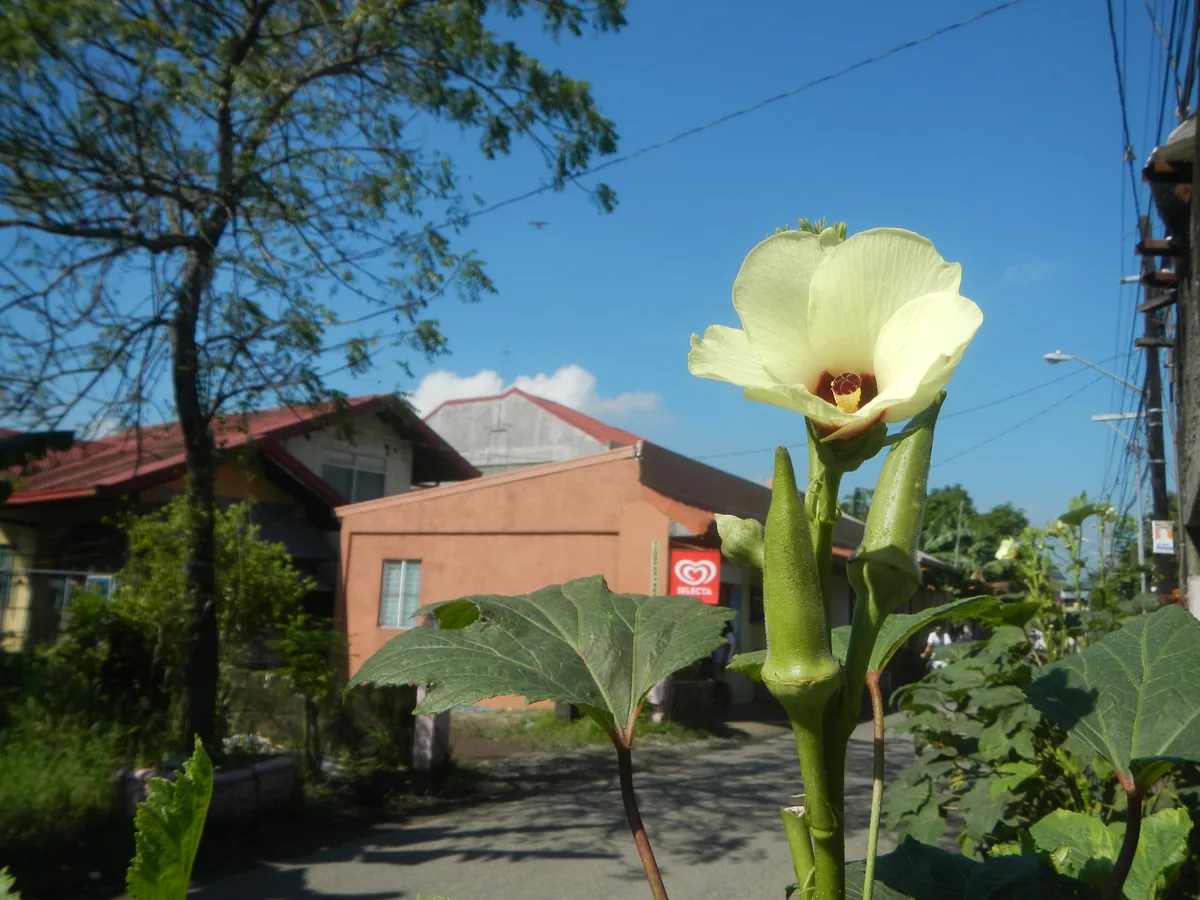
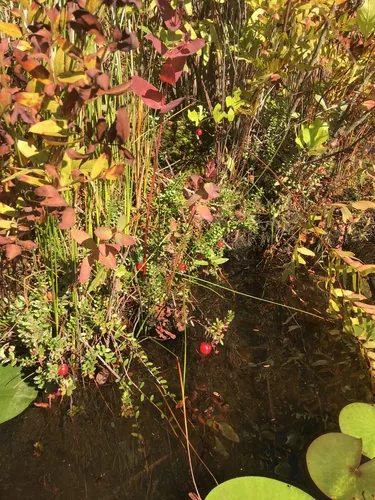
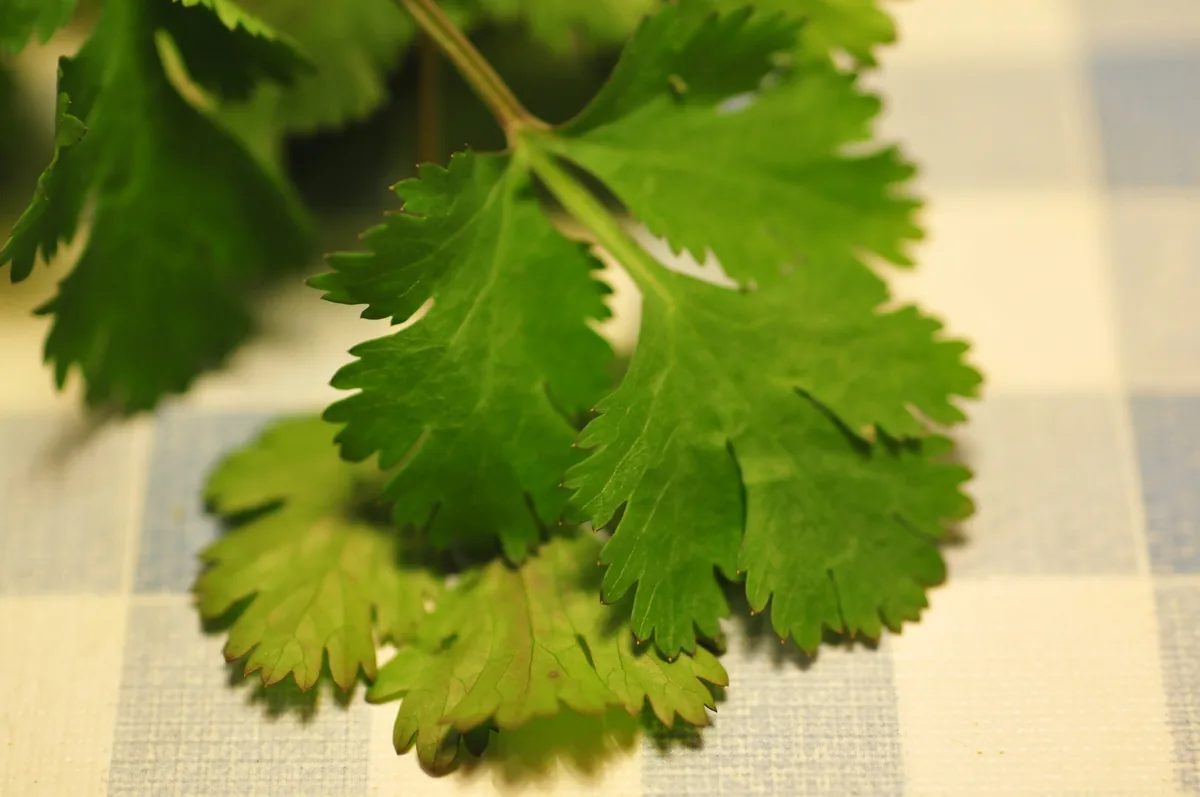
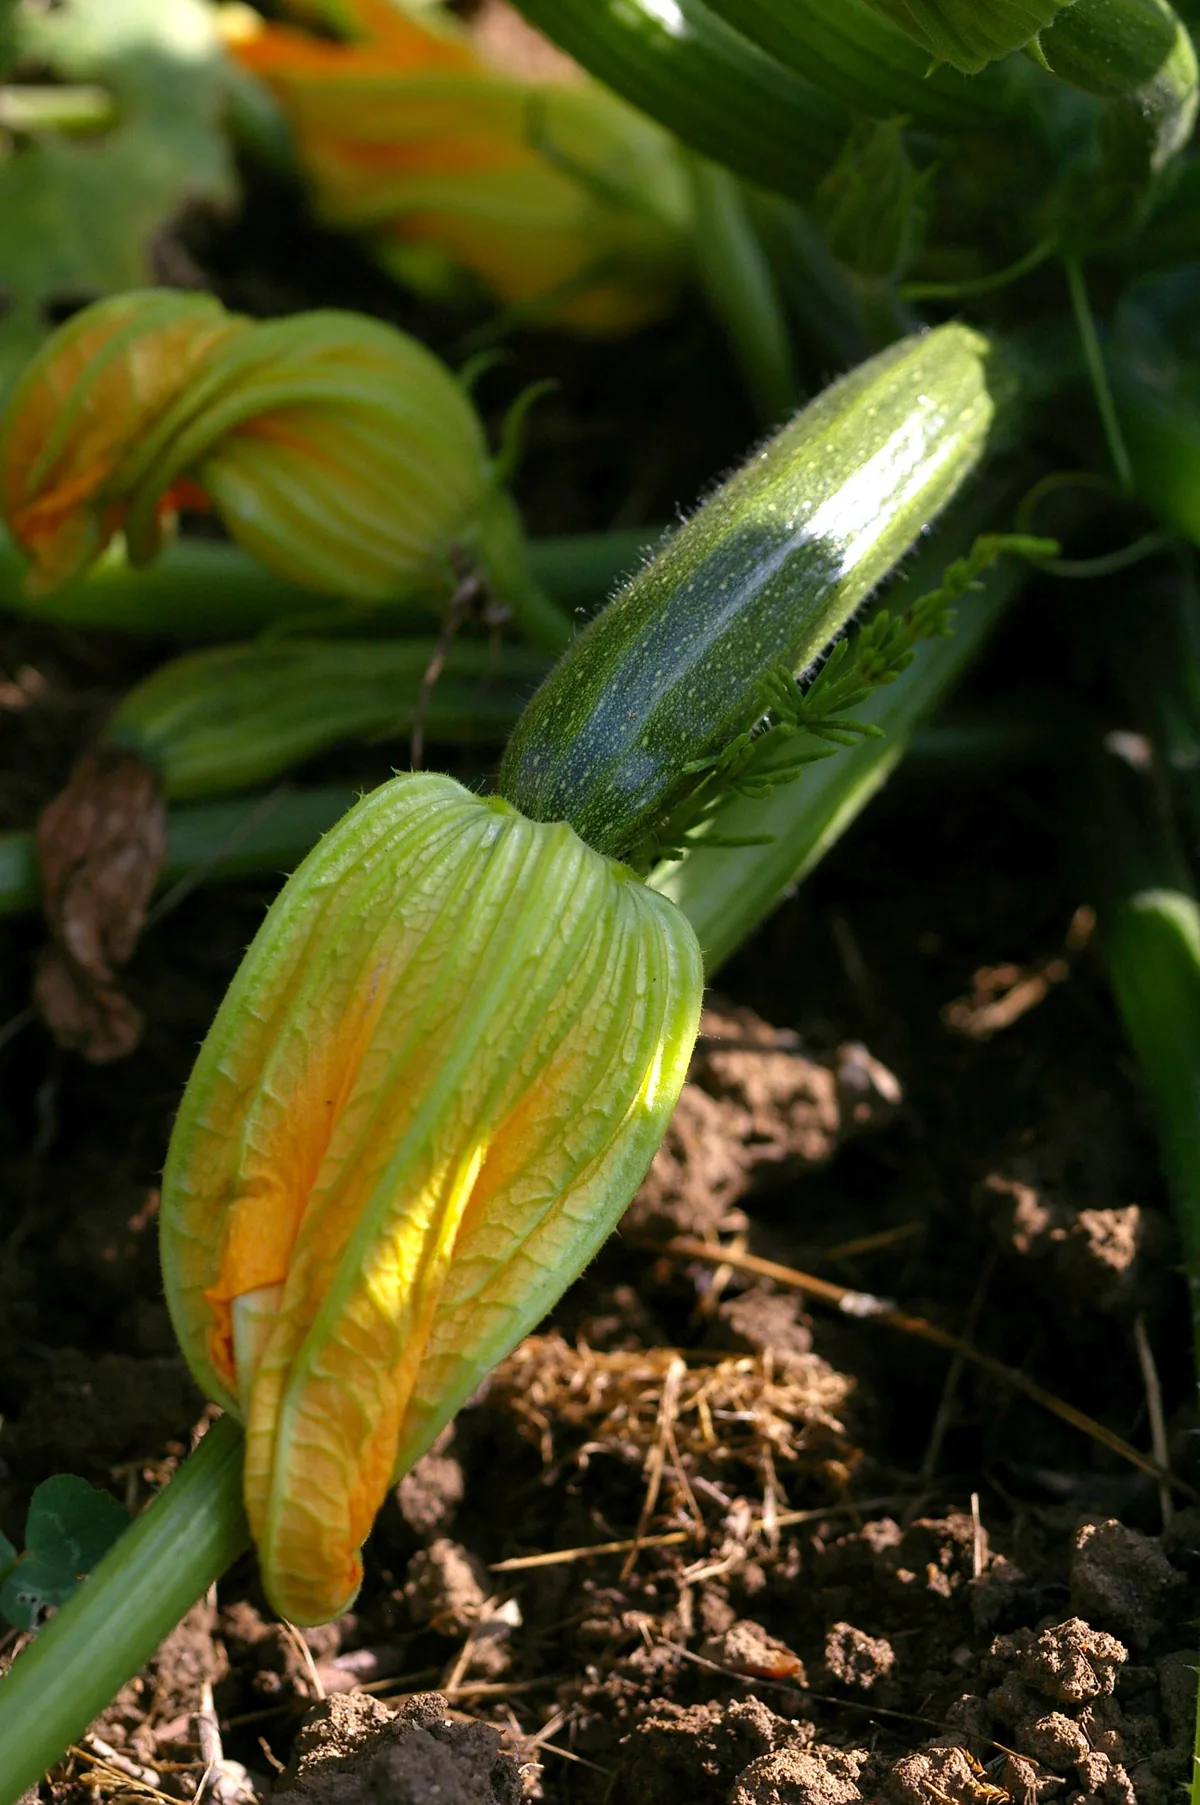
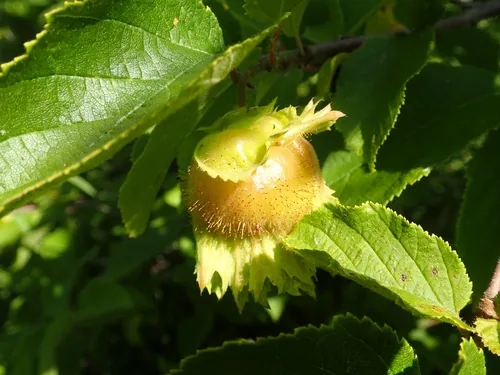
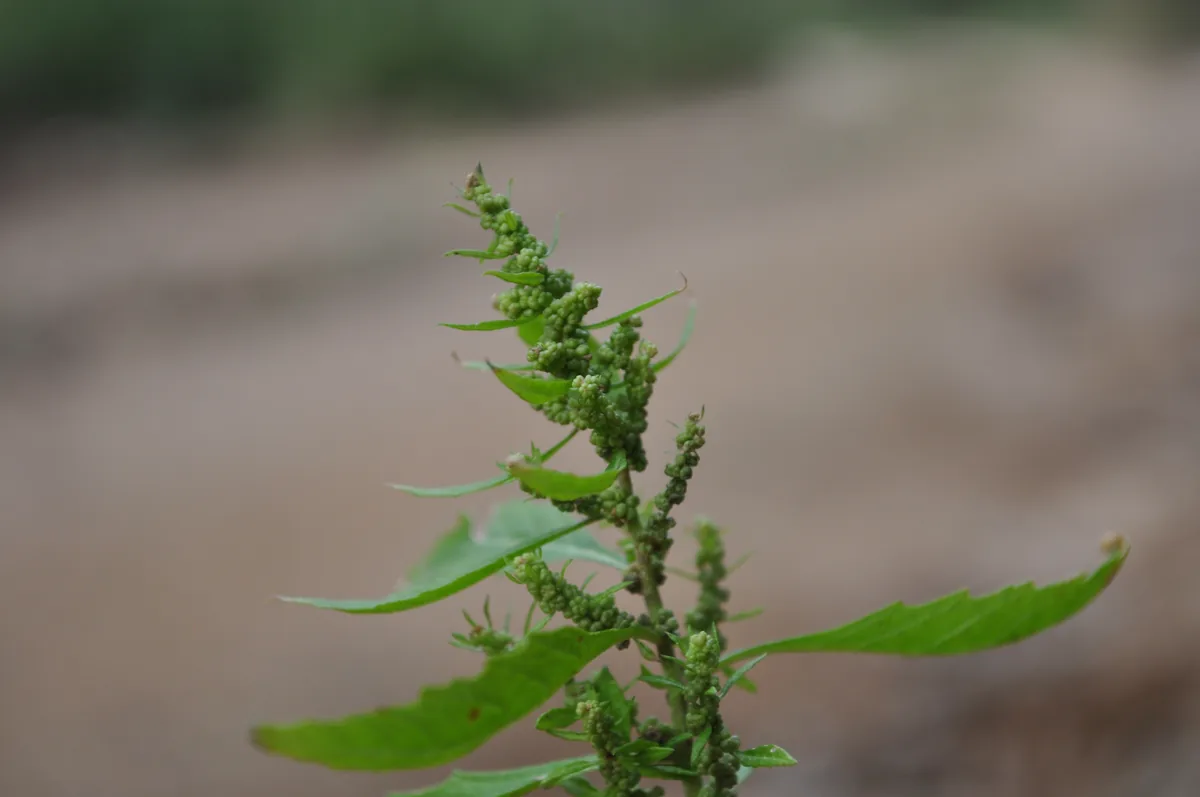
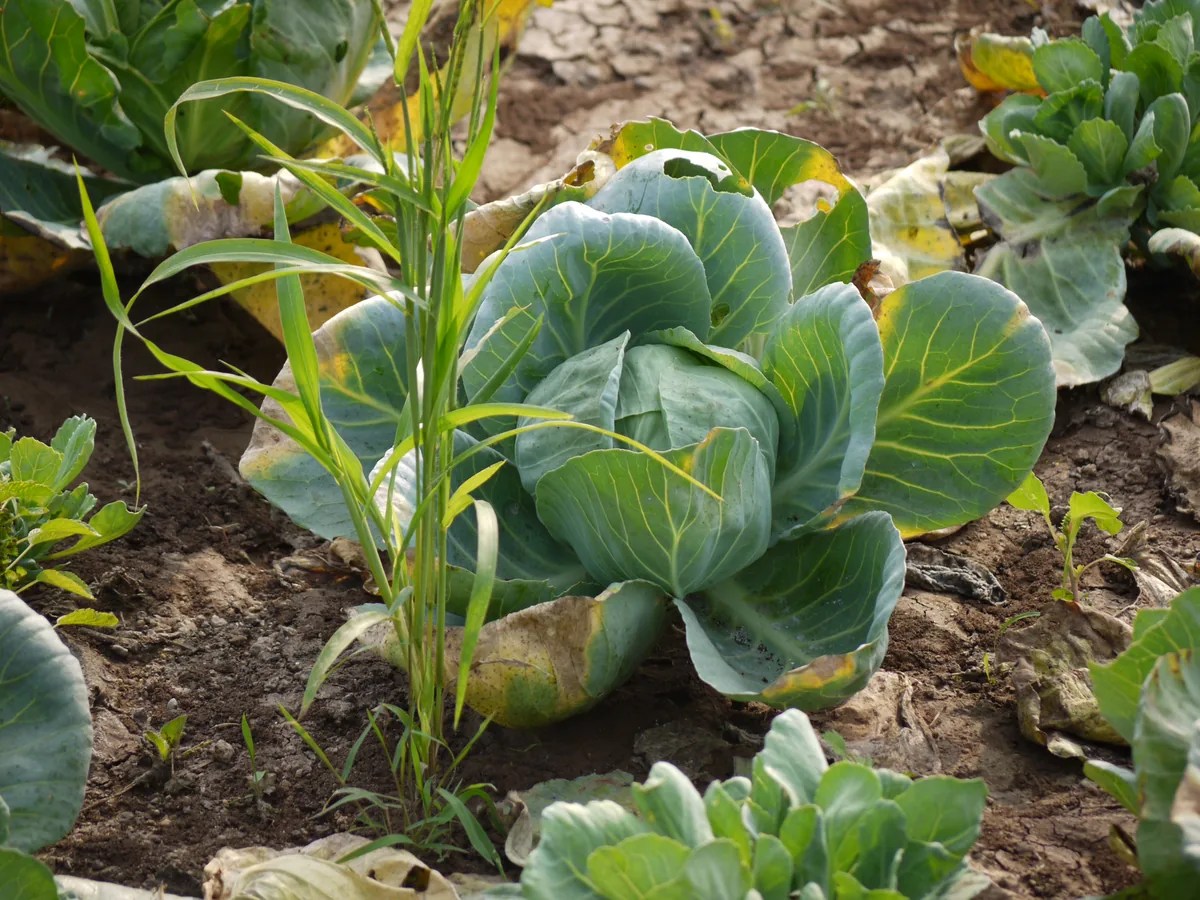
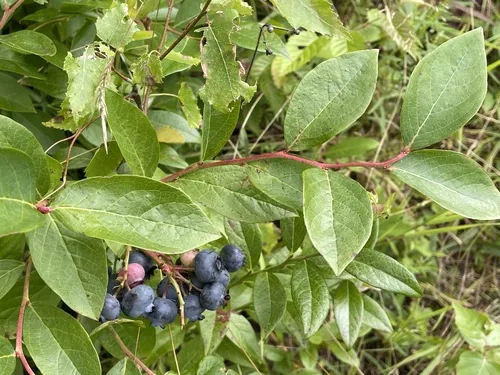
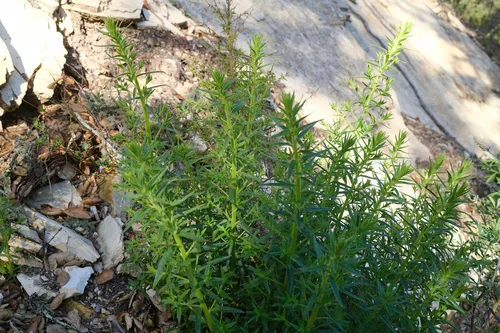
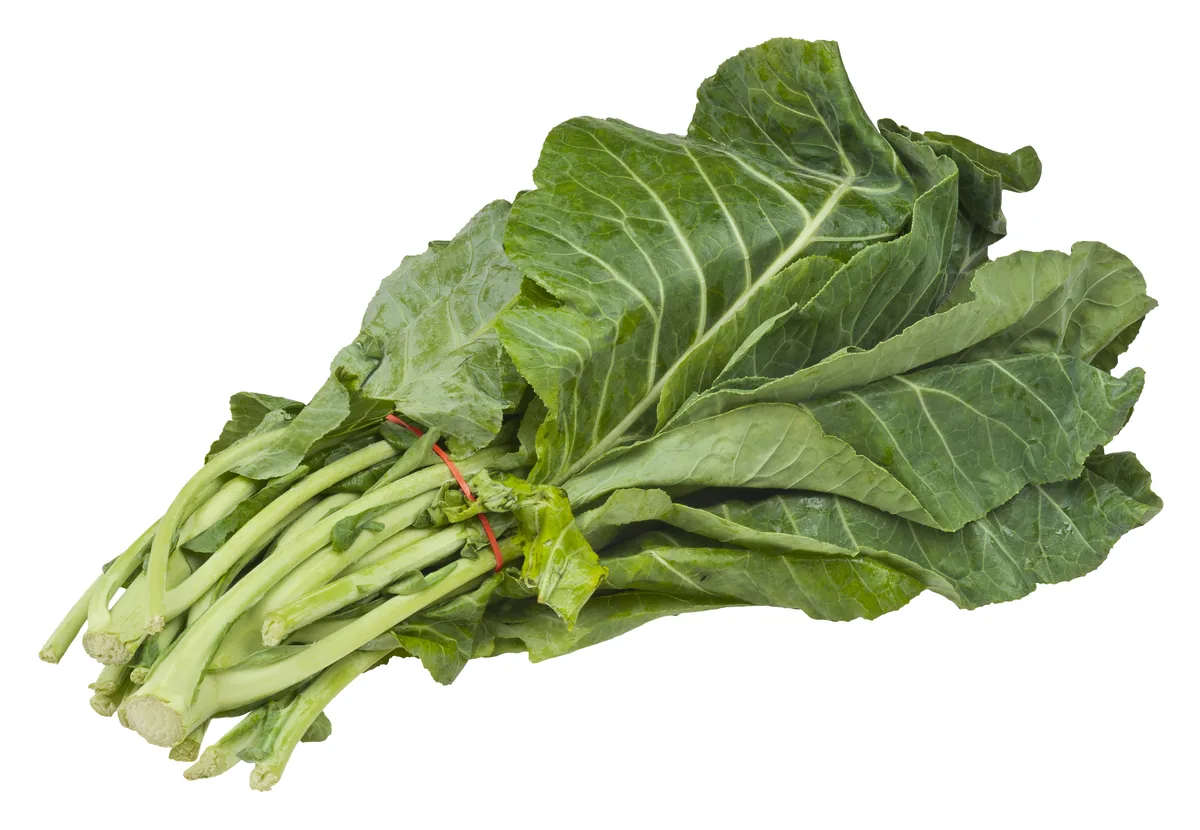
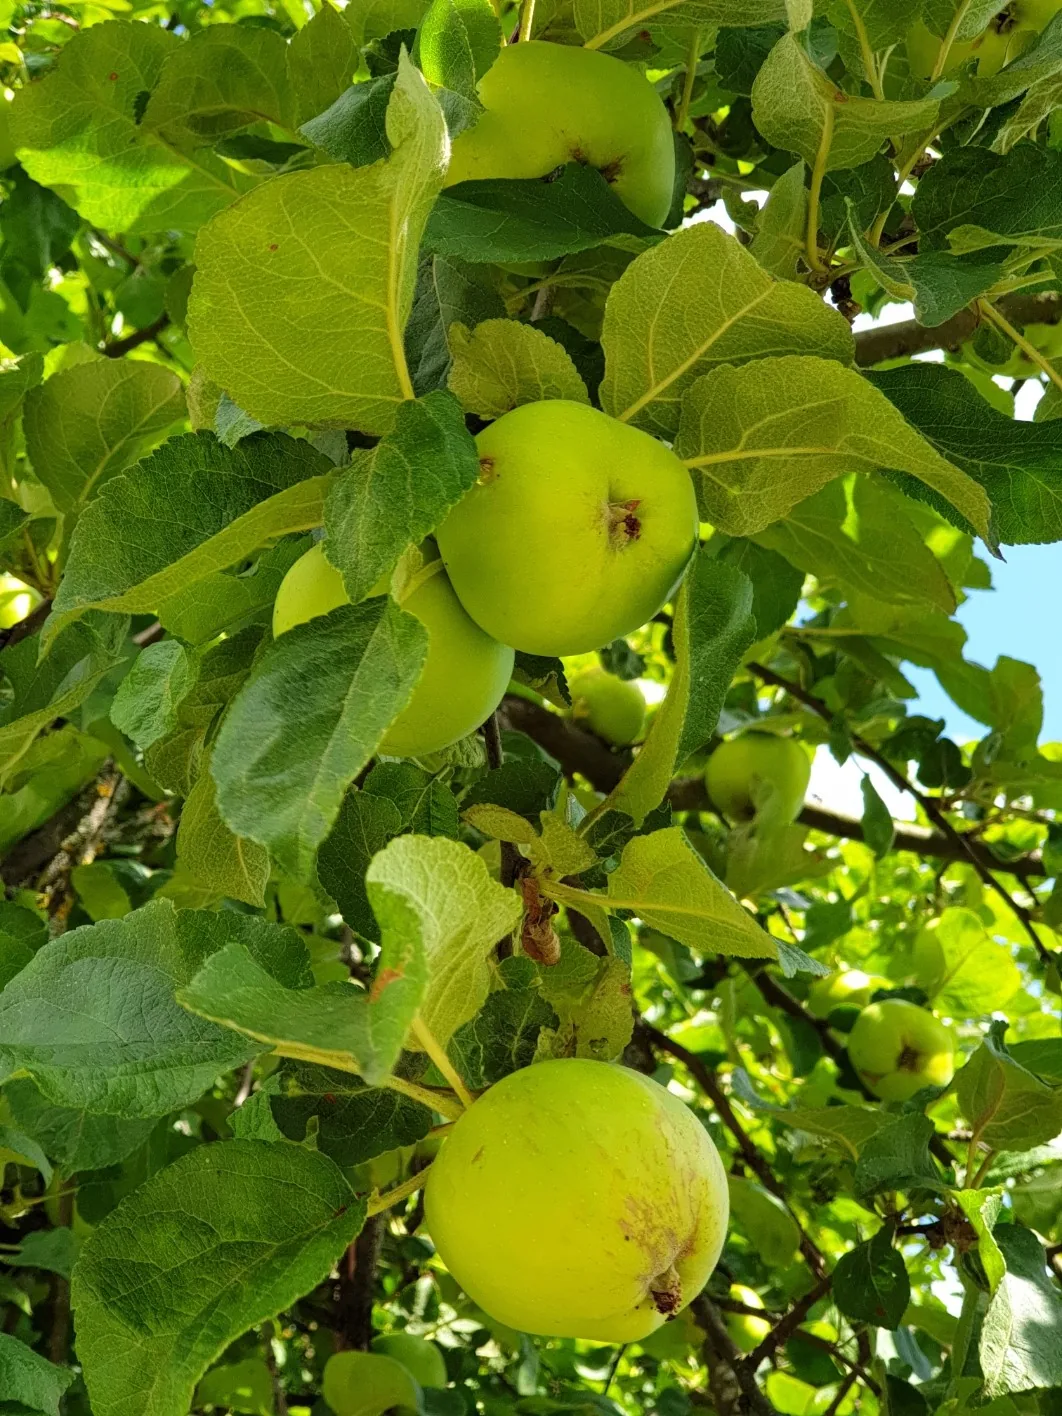
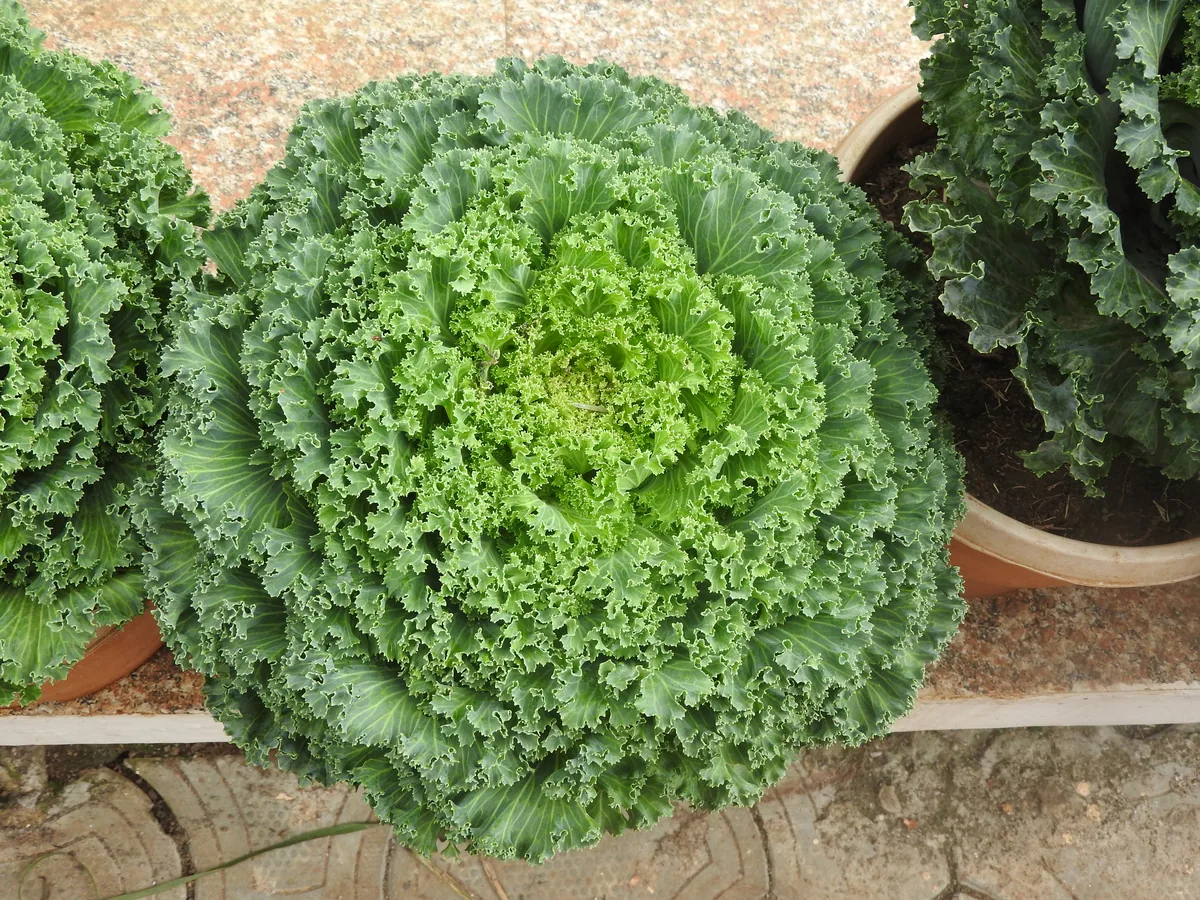
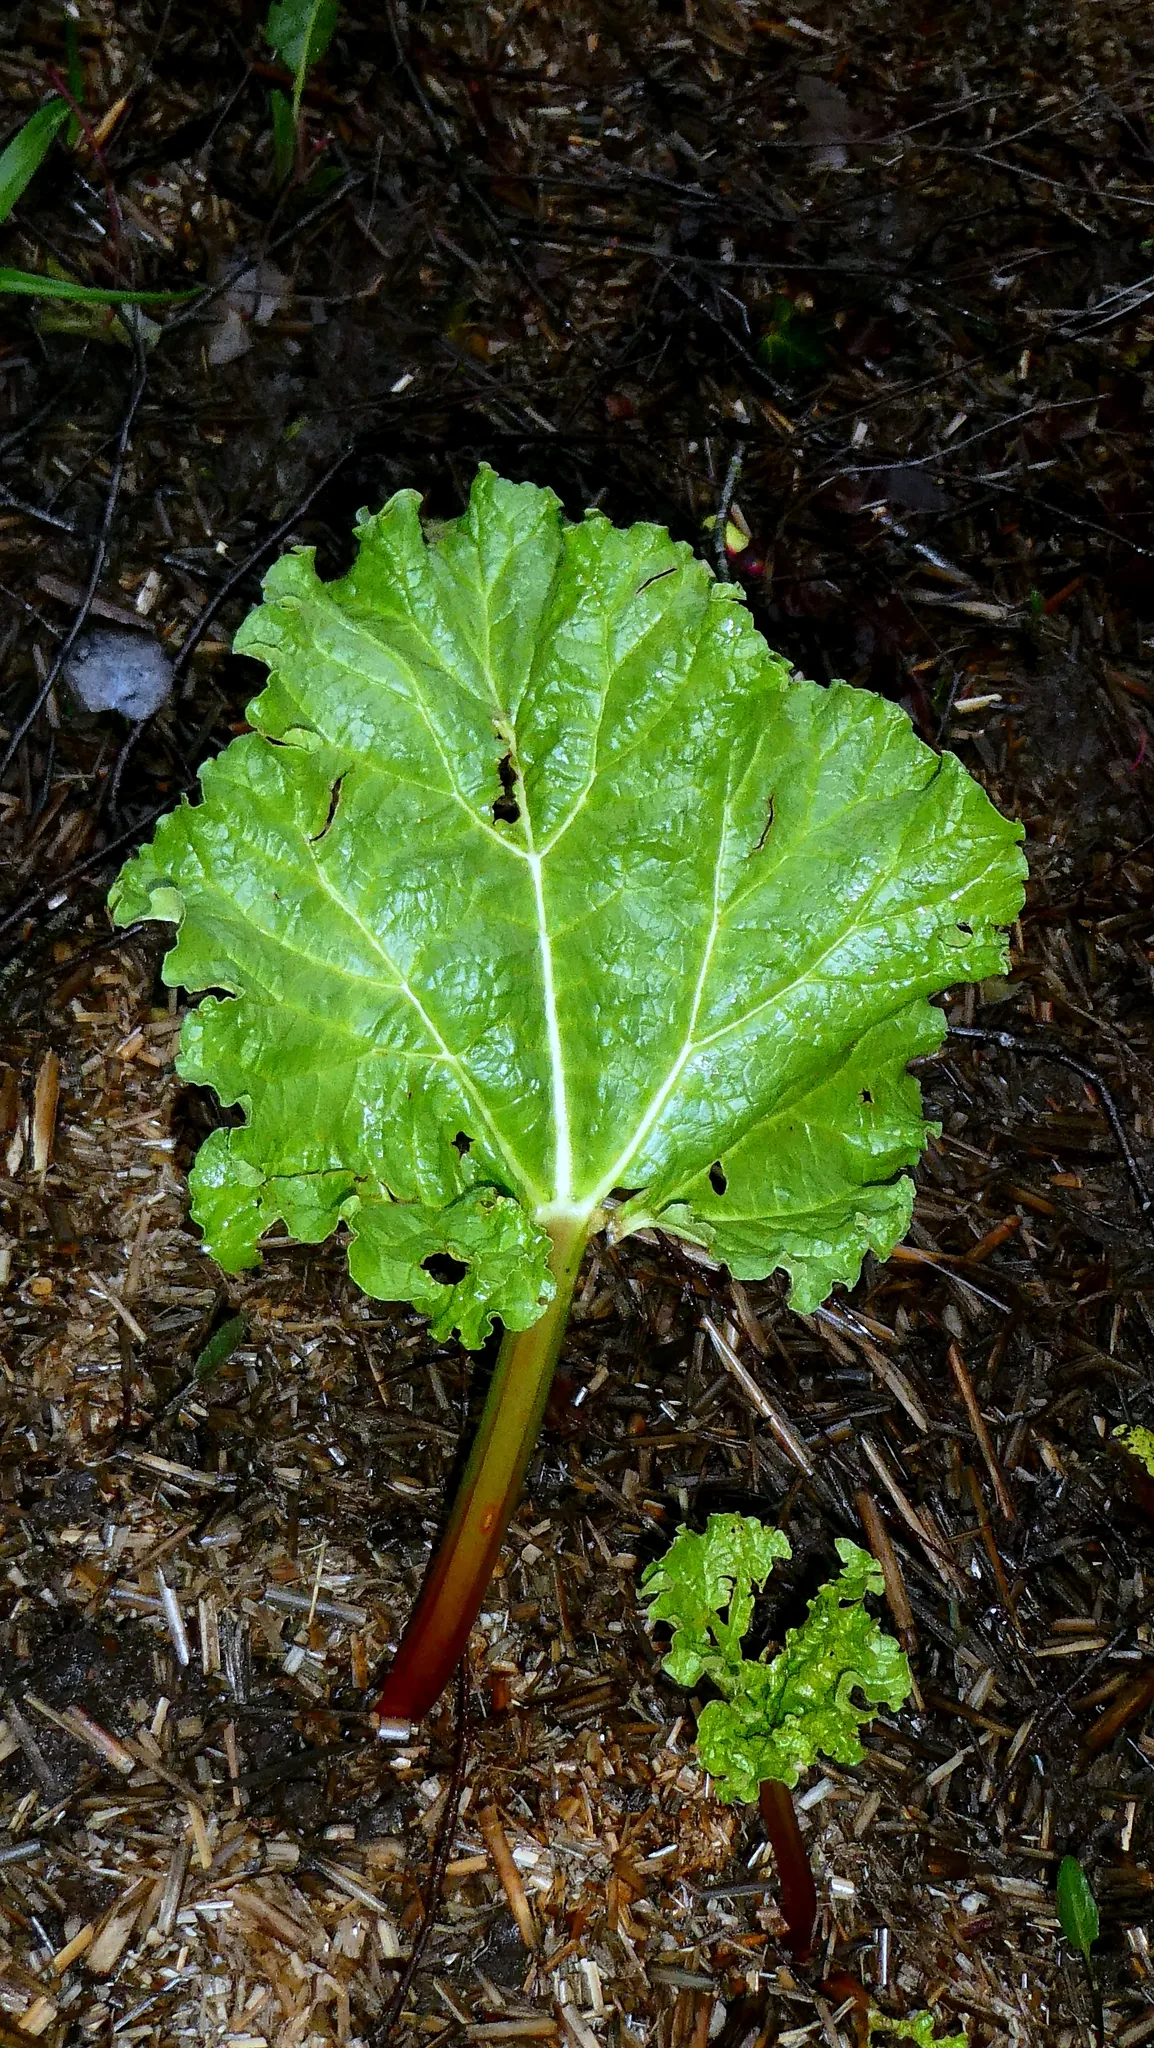
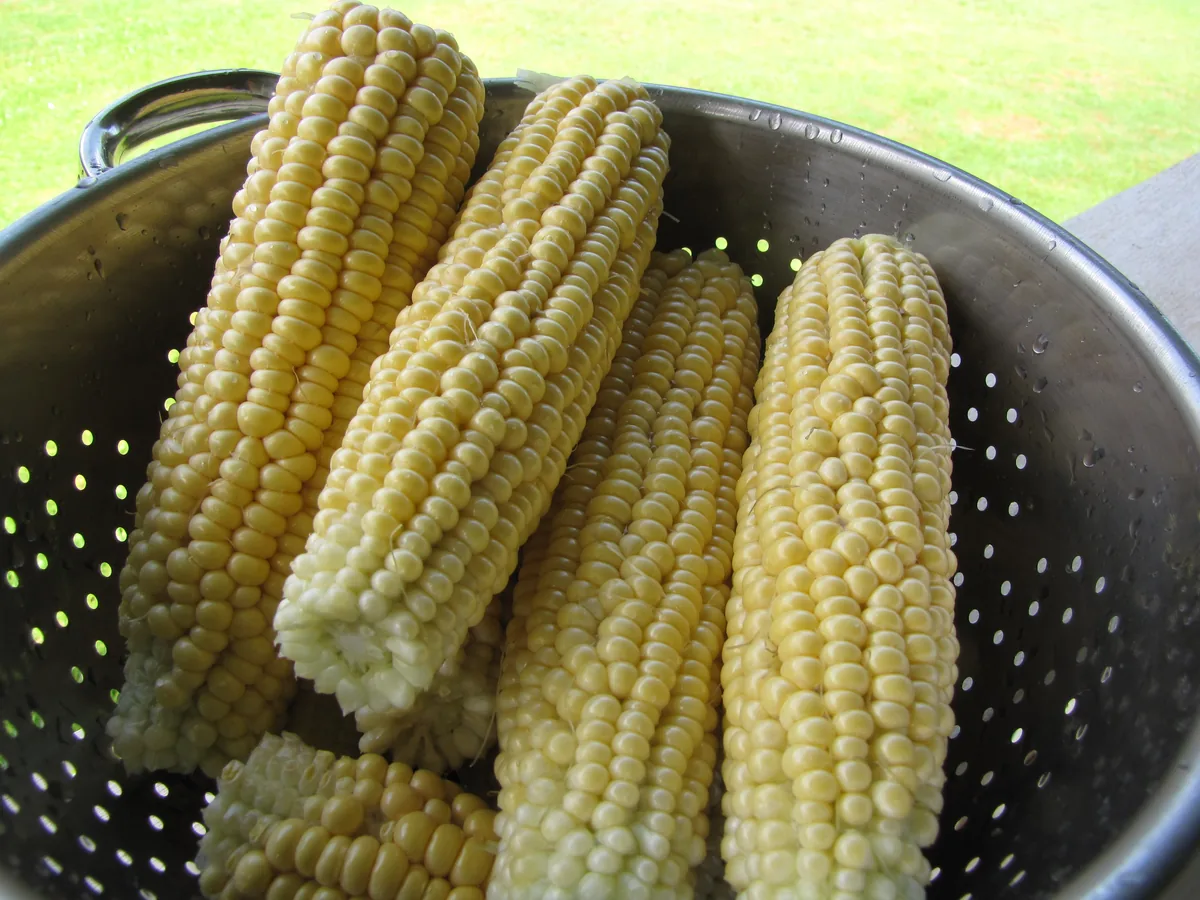
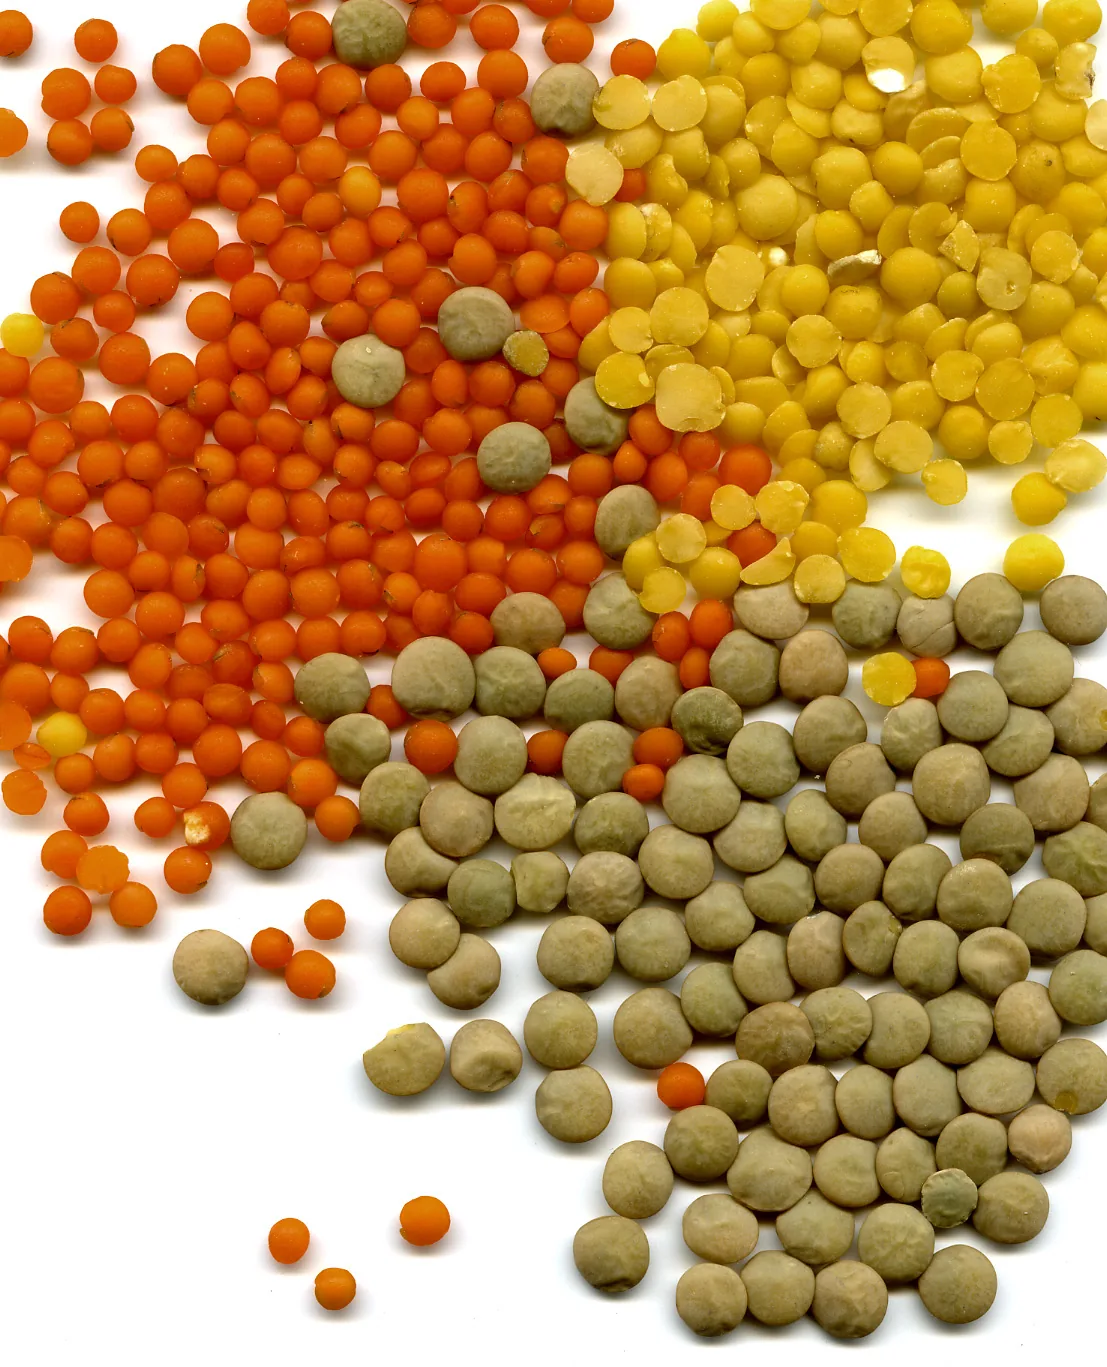
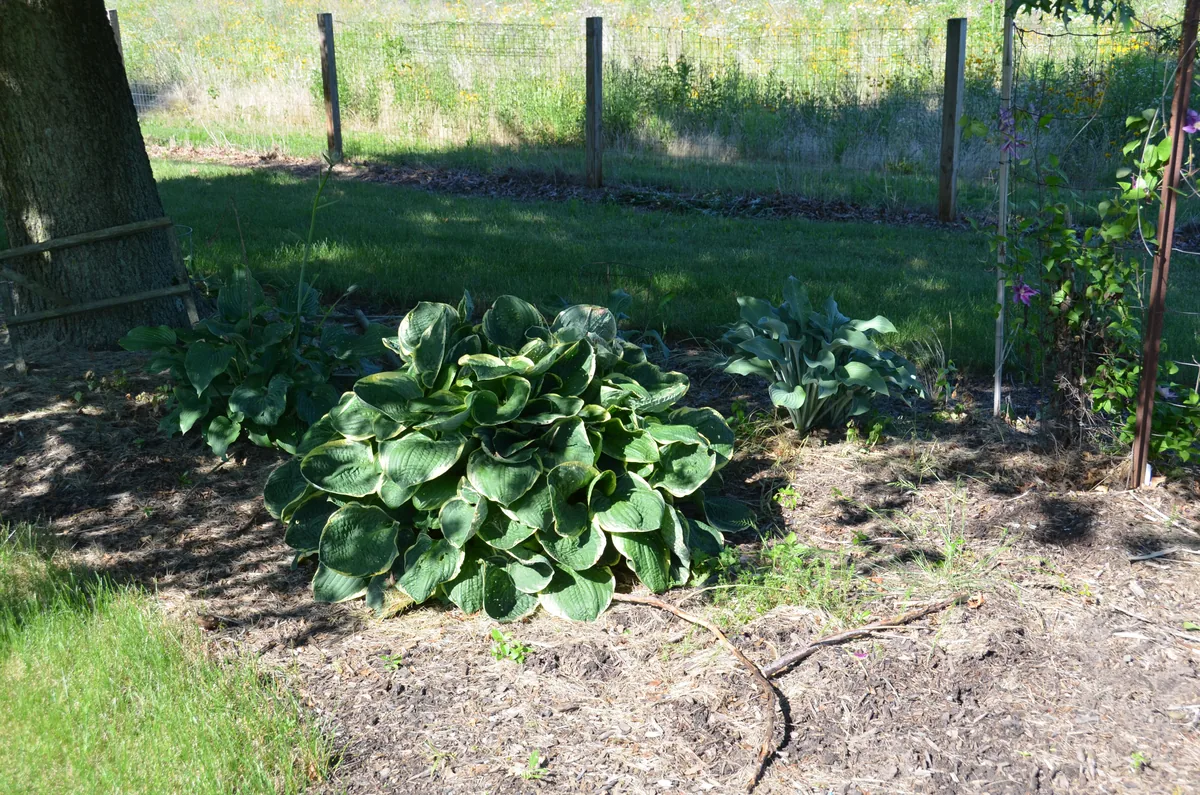


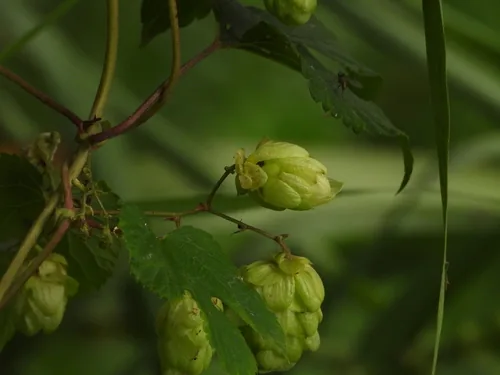
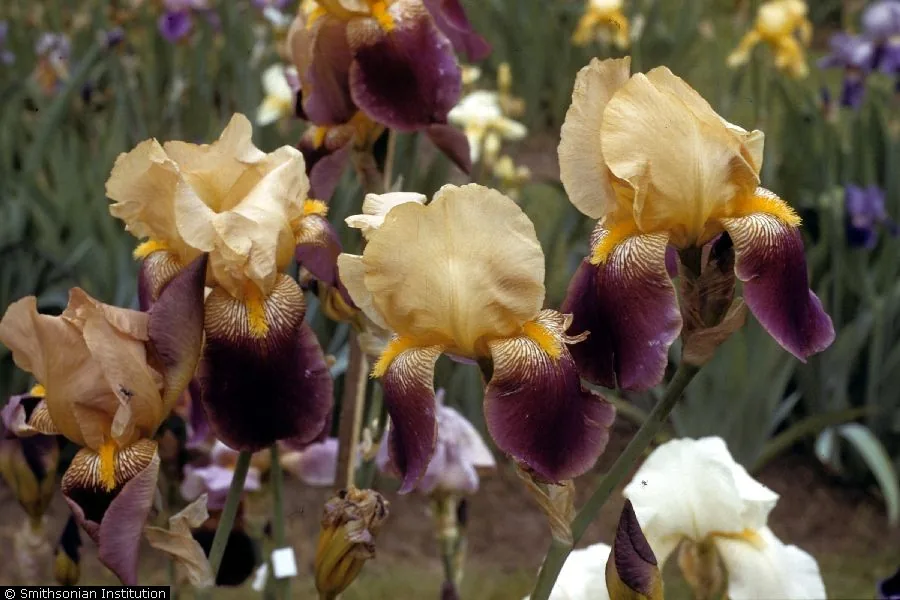

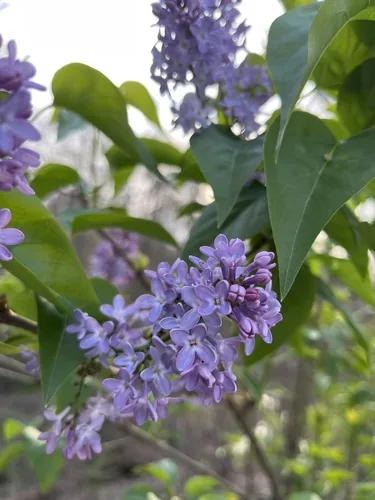
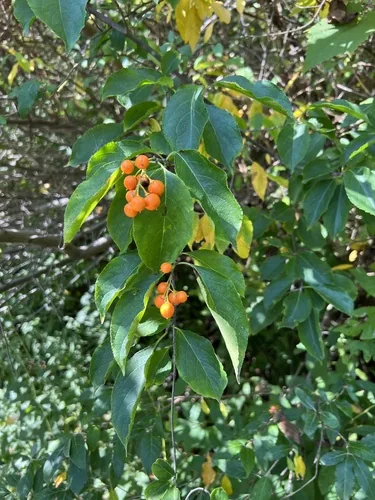
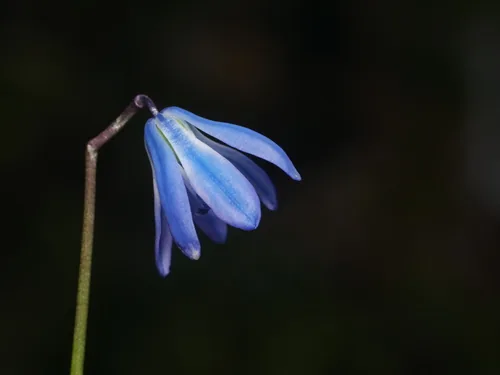
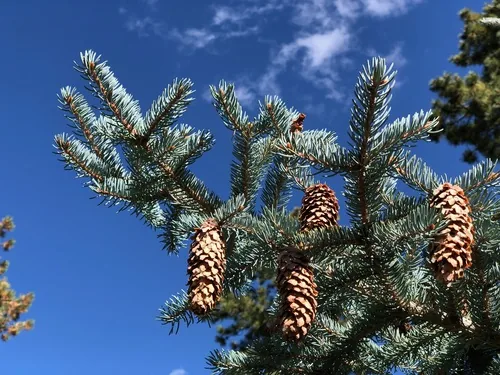

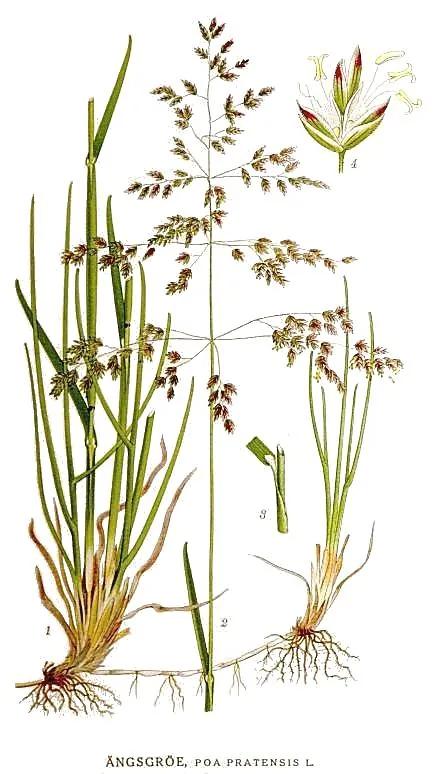
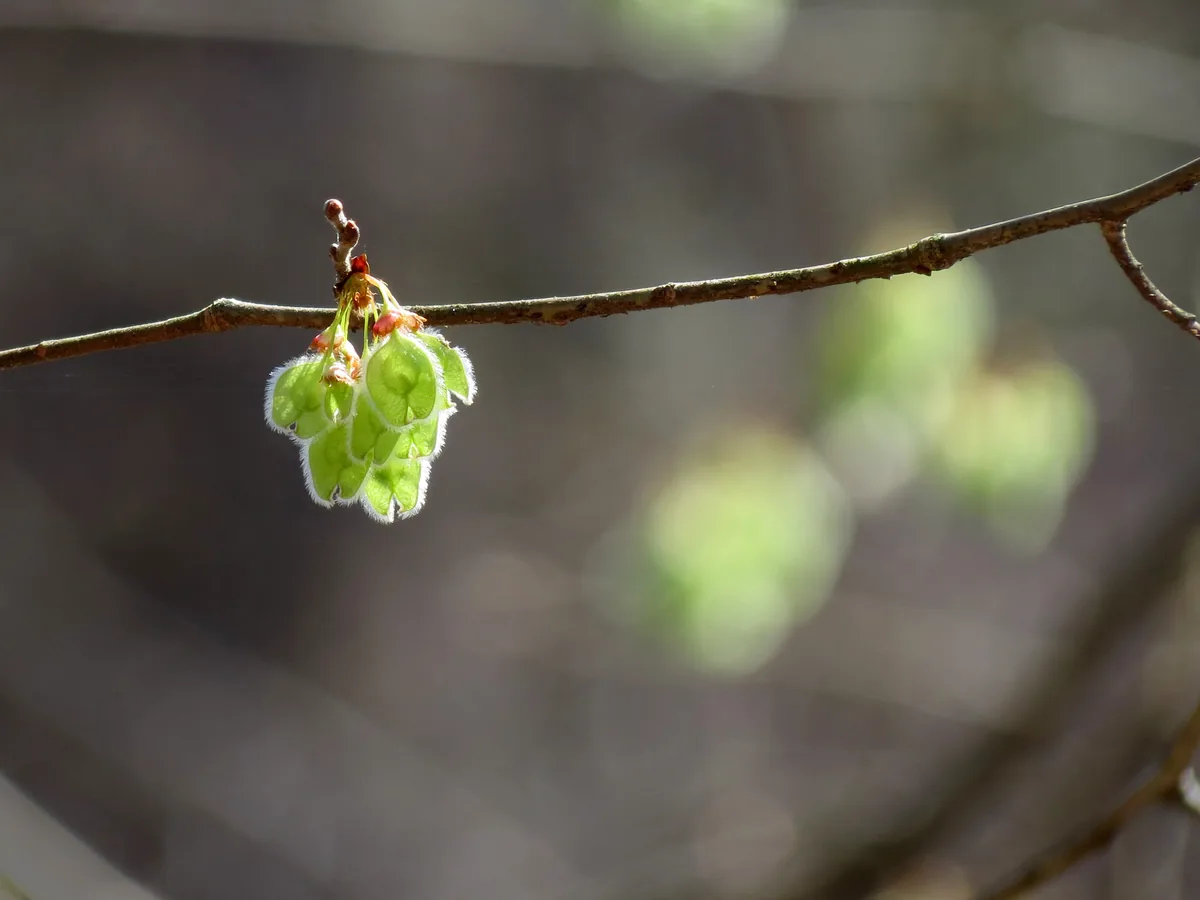
More to grow in Montana
Montana has a growing page for many more plants than fit above — a rotating sample of the rest of the shelf.
Is it too late to plant in Powell County?
Usually not — gardeners here simply switch what goes in the ground as the season moves. Cool-season crops can go in from around Apr 21; tender transplants wait until two to three weeks after the last 28°F hard freeze, which lands near May 19 (NOAA 1991–2020 climate normals); and from midsummer, planting counts back from the first fall freeze around Sep 12 — long-season crops need about 90 days of runway, quick greens only 30. Short seasons reward decisiveness — quick-maturing varieties late, hardy greens under cover, and next year’s garlic in the ground before it closes.
What gets applied to farmland in Powell County
USGS estimates 1,368 lb of Glyphosate on Powell County farmland in 2019, its largest by weight, ahead of 2,4-d (1,216 lb) and Diuron (612 lb).
Farmland across the whole county, not any one lot. Check your address for the site-by-site record.
 Safe to Grow Here?
What the federal record shows across Powell County — and how to grow with it.
We checked the federal record across Powell County — 523 documented sites across 7 of the 8 source types we track.
The most significant on record: 1 Superfund site (none NPL-listed). Sites tracked in EPA's Superfund program — from assessment-stage CERCLIS entries to confirmed National Priorities List cleanup sites.
Powell County carries one of the heavier federal records we track — and that's not a verdict on your yard. Proximity to a documented site is information, not a diagnosis: nothing here says any particular parcel is affected. It does earn one concrete step — before food beds go in the ground, a professional soil test tells you exactly what you're working with, and raised beds with clean imported soil grow well almost anywhere in the meantime.
Sources: EPA, USGS — 1.8M documented sites tracked nationwide across 8 federal source types.
What's on the federal record near Powell County
Closest first, across Powell County. Listing isn't leaking, and distance isn't exposure.
- AT & T COMMUNICATIONS GOLD CREEK RADIOUnderground Storage Tanks · 0.9 mi
- POWELL COUNTY SHOPS HELMVILLEUnderground Storage Tanks · 2.1 mi
- BN GILLILAND MICROWAVEUnderground Storage Tanks · 2.1 mi
- Smith-Jones MineMining · 2.9 mi
- Hobby Horse MineMining · 3.2 mi
- Corbin MineMining · 3.3 mi
- Big Blackfoot DistrictMining · 3.4 mi
- Hill TopMining · 3.4 mi
- HigginsMining · 3.5 mi
- Plutarc MineMining · 3.5 mi
- Last Chance MineMining · 3.6 mi
- Blackfoot MineMining · 4.2 mi
6 more sites are on the record inside the same radius.
Measured from Powell County's center, not your beds. Run your own address for what's upwind of you specifically.
Browse the full contamination data for this area
Environmental Intelligence
The counts behind that headline — every source type on the record near Powell County.
Total Sites
523
across Powell County
Risk Level
High
Highest-severity
1 Superfund site (none NPL-listed)
Sources Checked
across Powell County
Severity Distribution
across Powell County
Highest-Severity Sites

A note from Gnorman
What an experienced grower watches for around here
In and around Powell County, two things run higher than the national average across Powell County — Mining (197 sites) and Nitrate (256 sites). It's not cause for alarm — it's worth knowing, and there's a sensible way to grow around it.
Mining: Mining sites — both historic and active — can leach heavy metals (arsenic, lead, cadmium, mercury) into soil and water for centuries after operations cease.
Nitrate: Nitrate contamination primarily comes from agricultural fertilizer runoff and failing septic systems.
Test soil for heavy metals (lead, arsenic, cadmium, mercury) — this is essential near any mining site.
Test well water for nitrate if you rely on a private well for irrigation (EPA standard: 10 mg/L).
Check your specific parcel in Powell County
Get exact proximity distances to contamination sources for your specific parcel — plus soil, sun, drainage, and 1,085 plant recommendations.
25+ data sources read at your address, not the Powell County average
Your land is one point inside Powell County
Everything above resolves to Powell County as a whole — one PHZM band and one county frost record, read across 1.5M acres. Your parcel is one point inside that footprint. Slope, tree cover, a low spot that pools cold air, and what is in the soil are all resolved at the address, and none of them are visible at county scale. That is the honest boundary of this page, and the reason the next step is a reading of your own ground rather than a better county average.
Your Lot vs the Powell County Average
Powell County Average
- ●USDA Zones 4b, averaged across Powell County
- ●One soil character for all of Powell County
- ●Frost dates read at Powell County's scale: May 19 to Sep 12
YOUR Parcel
- ✓Your exact zone, not Powell County's 4b
- ✓Your SSURGO soil type & pH
- ✓Your sun exposure, cast in 3D
See MY Growing Report
Read your parcel in Powell County
Pull a site-specific report for your exact address in Powell County, Montana — soil, sun, drainage, frost risk, and scored plant recommendations.
Three things about your lot that Powell County averages can't show:
We read public map data around Powell County — soil, climate, flood, and parcel records. How we handle your address.
25+ data sources read at your address, not the Powell County average
How we know this about Powell County
The datasets: hardiness from the USDA ARS Plant Hardiness Zone Map 2023, read at county grain; hard-freeze dates from NOAA 1991–2020 28°F normals at this county’s own record where one resolves, and the labelled statewide window where none does; soils from the USDA NRCS SSURGO survey, area-weighted across the county’s own map units; boundaries and acreage from US Census TIGER/Line 2025; the contamination and pesticide records from the federal sources named in their beats above. Where Powell County carries no record of its own, the figure is inherited and labelled — the resolution ledger below names each.
Common questions about Powell County
When does frost risk typically end in Powell County?
The last hard freeze (28°F) in Powell County typically lands around May 19, per NOAA 1991–2020 climate normals — earlier than the light-frost dates most charts quote. That marks the hard freeze, not the last light frost — lighter frosts keep biting past it, which is why tender transplants here wait until about Jun 9.
How long is the growing season in Powell County?
Measured between 28°F hard freezes, Powell County sees about 116 frost-free days — roughly May 19 through Sep 12, per NOAA 1991–2020 climate normals. Tender crops work a shorter one: nearer Jun 9 to Aug 29, about 81 days.
Is the soil safe to grow vegetables in Powell County?
The federal record around Powell County runs heavier than most — 523 documented sites, mostly Nitrate entries (256), the nearest Underground Storage Tanks record about 0.9 miles out — so test the soil before planting food in the ground, and raised beds with clean imported soil grow well in the meantime. Even here, proximity to a documented site is information, not a diagnosis of any one yard; the contamination map shows exactly what's recorded and where.
How do gardeners stretch the season in Powell County?
With about 116 frost-free days between hard freezes, Powell County rewards the classic extension moves: floating row cover buys roughly two to four extra weeks at each shoulder — on this season that is a working window nearer 144 to 172 days — and cold frames or low tunnels buy more. Starting transplants indoors ahead of the May 19 hard-freeze normal stretches the season without touching the calendar.
Everything above is measured at Powell County's scale — its 4b band and its 116-day season. Your yard writes its own version of Powell County's numbers: we read soil, sun, drainage and frost at your exact address. Try it for 14 days — no card required.
Will It Grow Here?
Zone fit is the first question — each answer below reads Montana's frost window, season length, and soil profile against the plant's real requirements.
What this page reads at Powell County’s own scale
8 of the readings below were taken at Powell County's own scale — its own ~116-day span between 28°F freezes, the 3 most extensive soil series mapped here and 523 documented sites inside its boundary; one is borrowed from a wider read, named and linked below.
Measured here
- Powell County's own USDA hardiness band, zones 4bUSDA PHZM 2023
- Powell County's own 28°F hard-freeze dates and its ~116-day span between themNOAA 1991–2020 Climate Normals
- The soil order, drainage, surface pH, and the 3 most extensive named soil series mapped in Powell CountyUSDA NRCS SSURGO
- 523 documented contamination sites inside the county boundary, distance-sorted from its center — the closest Underground Storage Tanks record about 0.9 miles outFederal environmental registers
- Powell County's boundary and the 1,488,666 acres inside itUS Census TIGER/Line 2025
- Which of 1,085 plants clear zones 4b and a ~116-day seasonGrowable Ground crop-matching engine
- The 2 ecoregions Powell County spans, Middle Rockies the largestUS EPA Level III Ecoregions
- Which agricultural compounds go onto Powell County farmland, and roughly how muchUSGS NAWQA EPest county estimates
Inherited from a wider read
- The growing challenges every Montana grower plans around — written at state scale, so they stay on the state guidefrom Montana
What this page can’t tell you
- How the season shifts across Powell County — the ~116 days above is one reading at its centre; the 24 towns below each carry their owntowns in this county →
- The soil pH, drainage, sun hours, and frost pockets on any one lot among Powell County's 1,488,666 acreswhy one lot differs from the next →
- Which of those 523 documented sites actually reaches your soil — that needs your address, the wind, and the groundwater directionhow we read the record →
- Where cold air settles, which slopes face the sun, and which way the wind runs on your own ground — none of it survives being averaged over Powell Countyread your own land →